Unit Cost Metrics
Overview
Unit Cost Metrics is a feature in Harness Cloud & AI Cost Management (CACM) that allows you to track and analyze custom business metrics over time. These metrics help you correlate cloud costs with business drivers like headcount, transactions, users, or any other quantifiable measure that's meaningful to your organization.
By tracking unit metrics alongside your cloud costs, you can calculate unit economics — understanding not just how much you're spending, but how efficiently you're spending relative to business growth.
What you can do with Unit Cost Metrics:
- Track business metrics (headcount, users, transactions, etc.) over time
- Ingest data via API, CSV upload, or JSON paste
- Visualize metric trends with interactive charts
- Monitor key statistics (totals, averages, date ranges)
- Calculate cost per unit
What is a Unit Metric?
A unit metric is a time-series measurement of any quantifiable business value that helps you understand your cloud spending efficiency. Instead of just knowing you spent USD50,000 last month, you can calculate that you spent USD1,000 per developer or USD0.05 per transaction.
Metric Components
Each unit metric consists of:
- Metric Name: A descriptive name for your metric (e.g., "Active Developers", "Monthly Active Users")
- This appears in the UI and should be clear to all stakeholders
- Auto-generates an identifier like
active_developersfor API usage
- Description (Optional): Additional context about what this metric measures
- Example: "Count of developers who committed code in the last 30 days, by team"
- Helps future users understand the exact definition and data source
- Records: Time-stamped data points with numeric values
- Each record is a single measurement at a specific point in time
- Example:
{ "usageTimeStamp": "2026-01-15T00:00:00Z", "value": 45 }
- Labels (Optional): Key-value pairs for segmenting your metrics
- Why use labels? They let you track the same metric across different dimensions
- Example: Track "developers" with labels
{"team": "platform"},{"team": "frontend"},{"team": "mobile"} - This allows you to calculate unit costs per team: platform team's infrastructure cost / platform team's developer count
- You can have multiple label dimensions:
{"team": "platform", "region": "us-east", "env": "production"}
- Aggregation Type: How multiple values should be combined when viewing data at different time ranges
- More on this in the next section - this is critical to get right!
Understanding Aggregation Types
Aggregation determines how your metric values are combined when you're viewing data over longer time periods or when multiple records exist for the same time period.
When does aggregation matter?
- When you have multiple records for different labels on the same day
- When viewing weekly or monthly charts (combining daily data)
- When calculating statistics like averages or totals
The Four Aggregation Types:
-
Sum - Add all values together
- Use when: Your metric represents a cumulative count across independent entities.
- Examples:
- Total headcount across teams: Platform (45) + Frontend (32) + Mobile (18) = 95 total employees
- Total API calls across regions: US (1M) + EU (800K) + APAC (500K) = 2.3M total calls
-
Average - Calculate the average
- Use when: Your metric represents a rate or intensity that shouldn't be added together.
- Examples:
- Average CPU utilization across servers: Server1 (80%) + Server2 (60%) + Server3 (40%) = 60% average (not 180%)
-
MAX - Show the maximum value
-
Use when: You care about the peak or capacity across measurements.
-
Examples:
- Peak concurrent users: Shows your highest load point (critical for capacity planning)
- Maximum database connections: Helps understand peak resource needs
- Highest transaction volume: Shows your busiest day
-
-
MIN - Show the minimum value
- Use when: You care about the baseline or lowest point.
- Examples:
- Minimum daily active users: Understanding your floor helps with baseline cost allocation
- Lowest available capacity: Identifies constraints
- Minimum SLA compliance: Finding your worst-performing period
All unit metric data is stored at daily granularity as cloud provider bills are typically calculated and delivered at daily granularity
Preconfigured unit cost metrics
Harness Cloud & AI Cost Management supports unit cost metrics by default. The costs are calculated automatically from your cost and usage data, with no additional setup. Each metric divides a cost by a count to show your spend per unit, such as cost per million tokens or cost per VM.
GenAI costs view
The following metrics are derived from generative AI (GenAI) provider cost and token data.
| Metric | Numerator | Denominator | Description |
|---|---|---|---|
| Cost per million tokens | Total token cost | Number of tokens (in millions) | Your effective price for every 1 million tokens processed |
| Cost per million input tokens | Input token cost | Number of input tokens (in millions) | Your effective price for every 1 million tokens sent to the model |
| Cost per million output tokens | Output token cost | Number of output tokens (in millions) | Your effective price for every 1 million tokens the model generates |
| Cost per inference | Total inference cost | Inference count | Average cost of a single model call, per provider |
| Cached token count % | Cached tokens | Total tokens | Share of tokens served from cache instead of fresh processing |
| Cached token cost % | Cached token cost | Total AI cost | Share of AI spend attributable to cached tokens |
| Input-to-output token ratio | Input tokens | Output tokens | Balance of tokens sent to the model versus generated |
All cloud costs view
The following metrics are derived from cloud resource cost and inventory data.
| Metric | Numerator | Denominator | Description |
|---|---|---|---|
| Cost per VM | Total VM cost | Number of VMs | Average spend per virtual machine, per provider (AWS, Azure, GCP) |
| Cost per storage volume | Total storage cost | Number of storage volumes | Average spend per storage volume, per provider |
AI traces view
The following metrics are derived from AI trace and agent telemetry.
| Metric | Numerator | Denominator | Description |
|---|---|---|---|
| Cost per million tokens | Total token cost | Number of tokens (in millions) | Your effective price for every 1 million tokens across traces |
| Cost per million input tokens | Input token cost | Number of input tokens (in millions) | Your effective price for every 1 million input tokens |
| Cost per million output tokens | Output token cost | Number of output tokens (in millions) | Your effective price for every 1 million output tokens |
| Cost per inference or request | Total cost | Inference count | Average cost of one model call or request |
| Cost per trace or run | Total cost | Number of traces or runs | Average cost of one agent trace or run |
| Cost per session | Total cost | Number of sessions | Average cost of one session |
| Cost per service | Total cost | Number of services | Average cost attributed to each service |
| Cost per agent | Total cost | Number of agents | Average cost attributed to each agent |
| Error rate | Error traces | Total traces | Share of traces that ended in an error |
| Average retries per trace or run | Total retries | Total traces | How often runs retry, a signal of wasted spend |
| Cached token count % | Cached tokens | Total tokens | Share of tokens served from cache instead of fresh processing |
| Cached token cost % | Cached token cost | Total AI cost | Share of AI spend attributable to cached tokens |
| Input-to-output token ratio | Input tokens | Output tokens | Balance of tokens sent to the model versus generated |
Engineering efficiency view
The following metrics are derived by combining cost data with your Git provider (SCM), issue tracker (IM), and AI tool telemetry.
| Metric | Numerator | Denominator | Description |
|---|---|---|---|
| Cost per pull request (PR) | Total cost | Number of PRs merged | Average cost to ship one merged pull request, also viewable by PR size |
| Cost per AI-assisted PR | Total cost | Number of AI-assisted PRs merged | Average cost to ship one PR that an AI tool helped write |
| Cost per AI-assisted commit | Total cost | Number of AI-assisted commits | Average cost of one commit that an AI tool helped write |
| Cost per work item | Total cost | Number of work items resolved | Average cost to resolve one work item, also viewable by work type |
| Cost per AI-assisted work item | Total cost | Number of AI-assisted work items resolved | Average cost to resolve one work item that an AI tool helped with |
| Cost per KLOC committed | Total cost | Lines of code committed (in thousands) | Average cost per 1,000 lines of code committed |
| Cost per commit | Total cost | Number of commits | Average cost of a single commit |
| Ship rate | AI lines of code committed | Total AI lines of code generated | How much AI-generated code actually makes it into your codebase |
| Error rate | AI tool call failures | Total AI tool calls | Share of AI tool calls that failed |
| Cache hit rate | Cache hits | Total cacheable requests | How often the AI prompt cache is reused, a cost-saving signal (Claude only) |
| AI-committed code % | AI lines of code committed | Total lines of code committed | Share of all committed code written with AI |
| AI-assisted PR % | AI-assisted PRs merged | Number of PRs merged | Share of merged PRs that used AI, also viewable by tool |
| AI-assisted work item % | AI-assisted work items resolved | Number of work items resolved | Share of resolved work items that used AI, also viewable by tool |
Creating a Unit Metric
Go to CACM > Account Settings > Unit Metrics >Create New to create a new metric.
- Define Metric
- Ingestion Method
When creating a new metric, add:
- Metric Name (required): A descriptive name for your metric
- Metric Identifier: Auto-generated from the name (e.g., "Active Users" → "active_users")
- Description (optional): Additional context about the metric
- Default Aggregation Type:
SUM: Add values together (useful for cumulative metrics like total users)AVG: Calculate average (useful for rate metrics)MIN: Show minimum valueMAX: Show maximum value
- Missing Data Handling: Real-world data collection isn't perfect. Your data pipeline might fail, your source system might have downtime, or you simply might not have data for weekends. Missing data handling tells Harness what to do with those gaps.
Show previous value: Carry forward the last known value. If there's no data for a day, use the last known value.Show as 0: Fill gaps with zero. If there's no data for a day, assume the value was zero.Leave blank: Don't fill gaps (not recommended). This simply skips that day in charts and calculations.
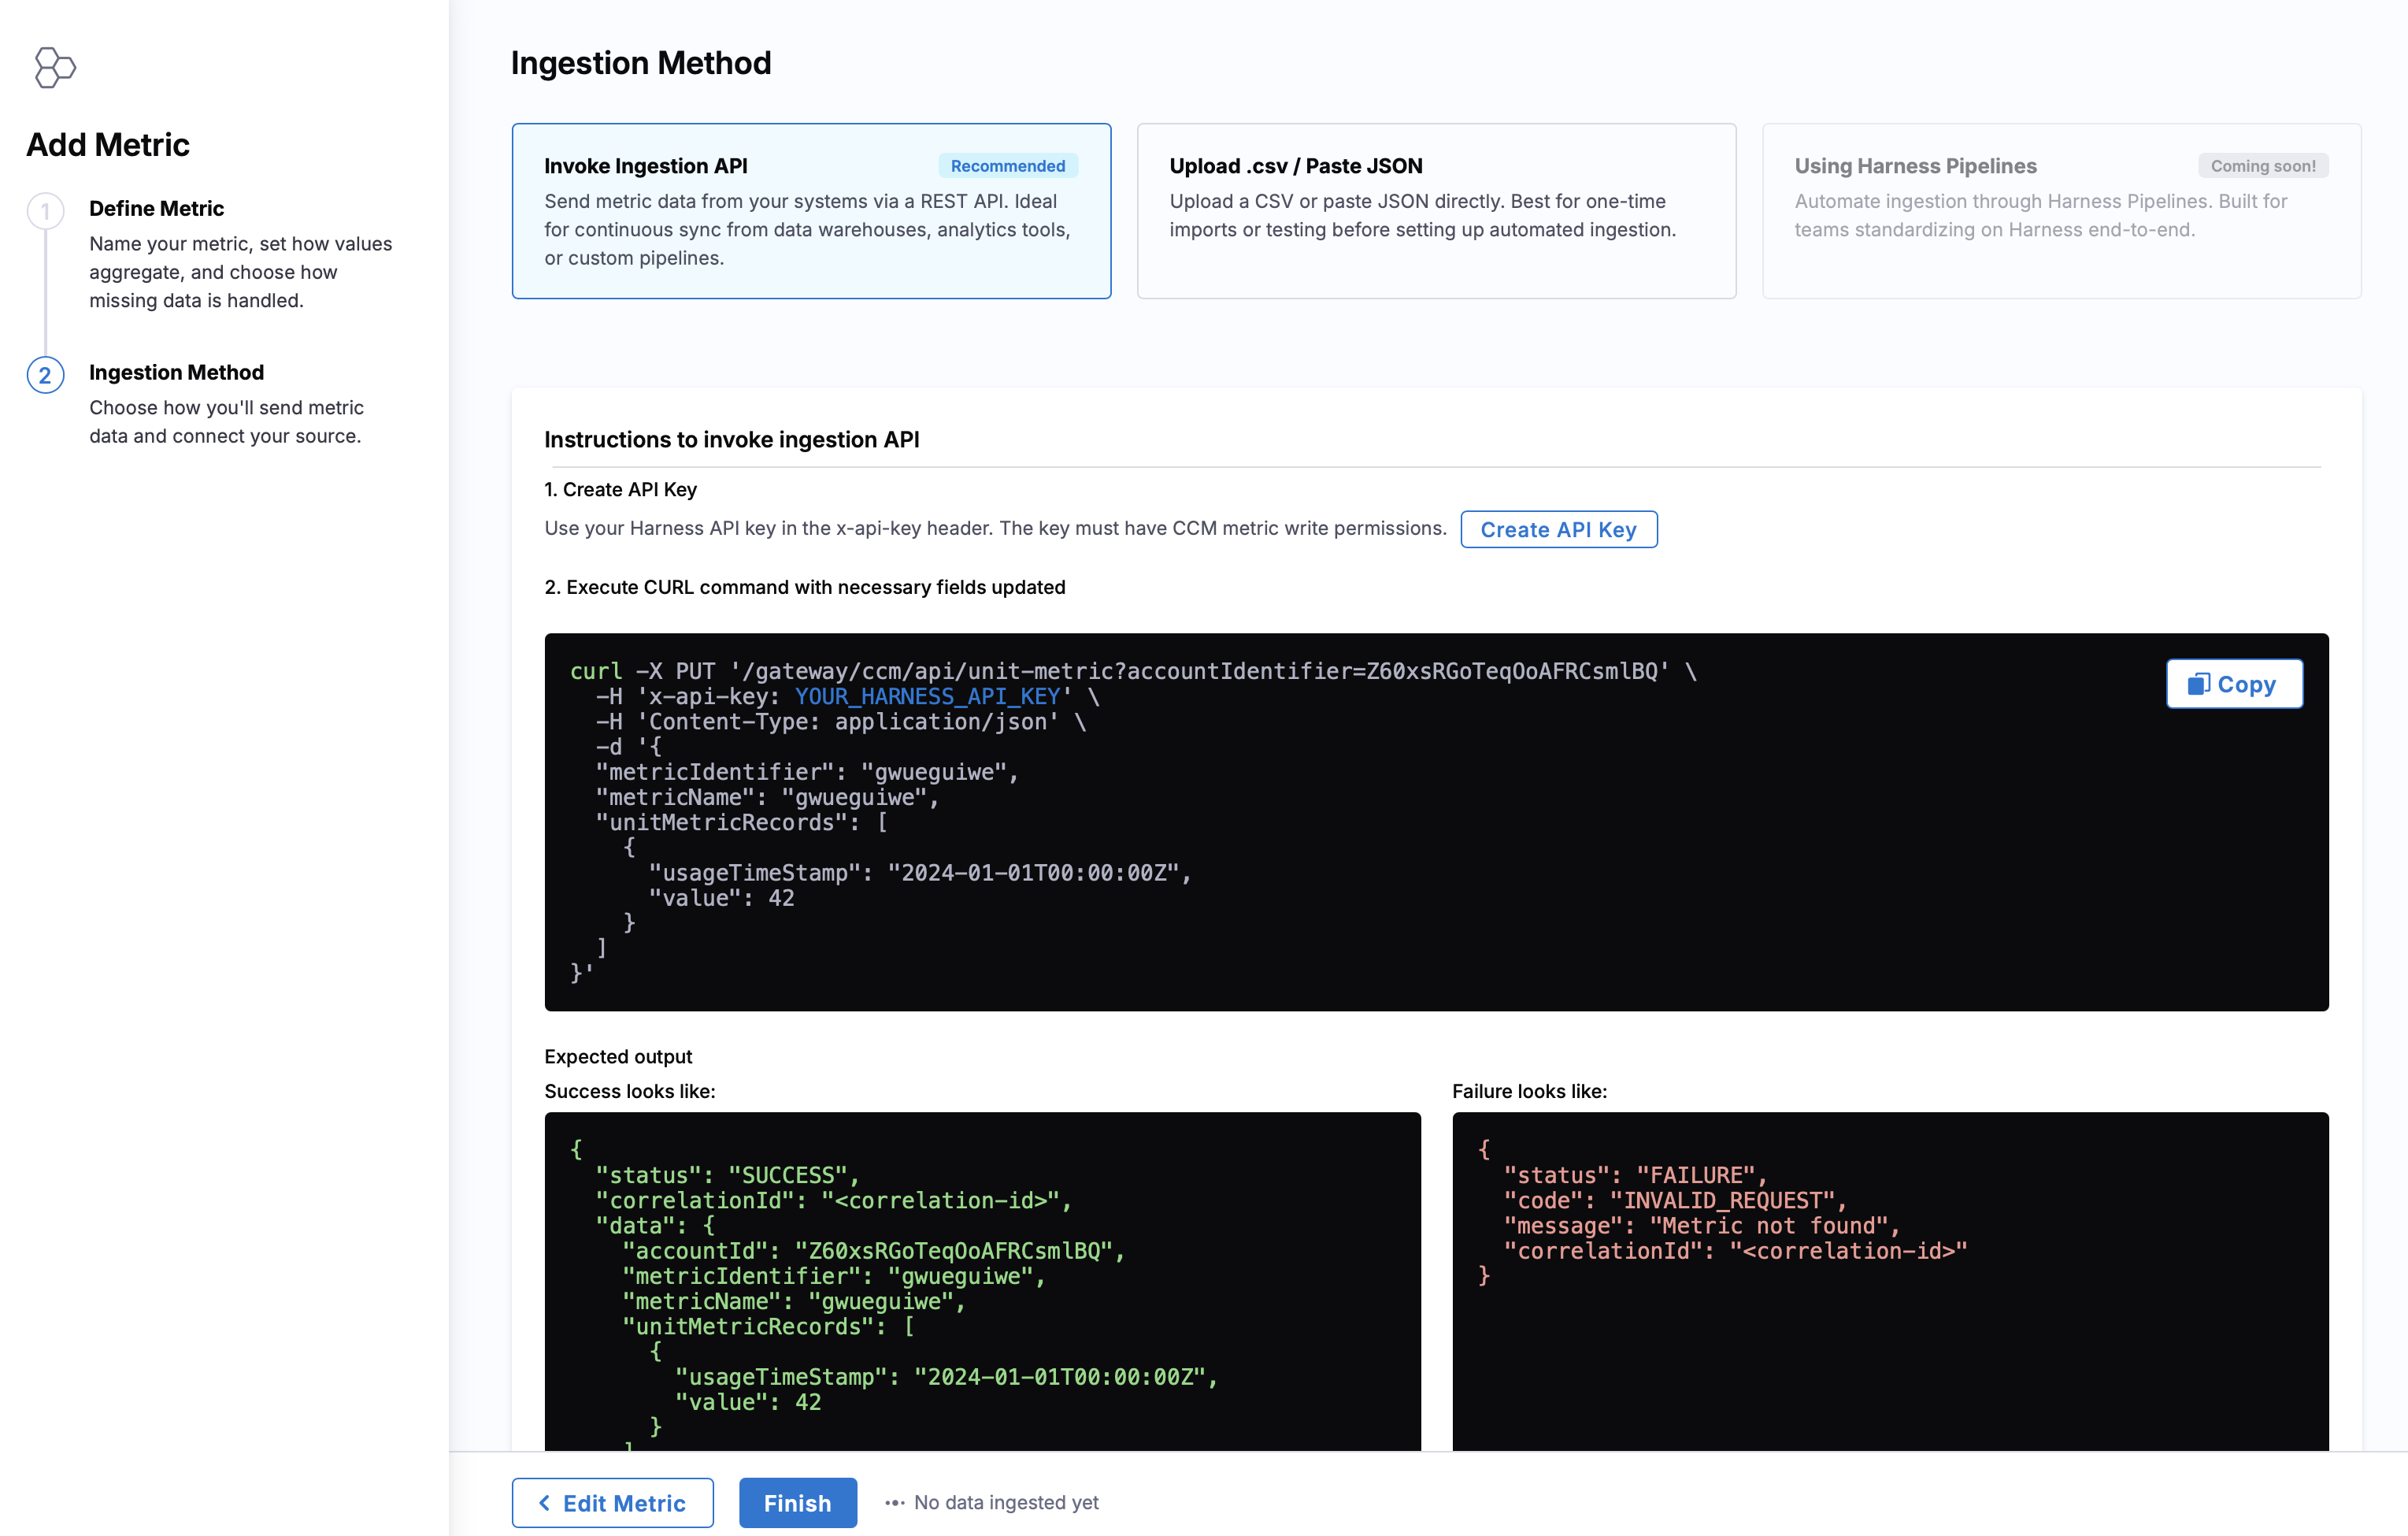
CACM supports three ways to ingest metric data:
-
Invoke Ingestion API (Recommended for Automation): Use the REST API to programmatically send metric data from your systems. Gather the metric values from your internal systems (HRIS, billing, observability, etc.) and format them as JSON. Each API call sends data for one metric + one label combination.
- Create API Key: Use your Harness API key in the x-api-key header. The key must have CACM metric write permissions.
- Execute CURL command to update metric data (PUT): Your screen shows the exact CURL command to run.
API Endpoint:
PUT https://app.harness.io/ccm/api/unit-metric?accountIdentifier={accountId} -
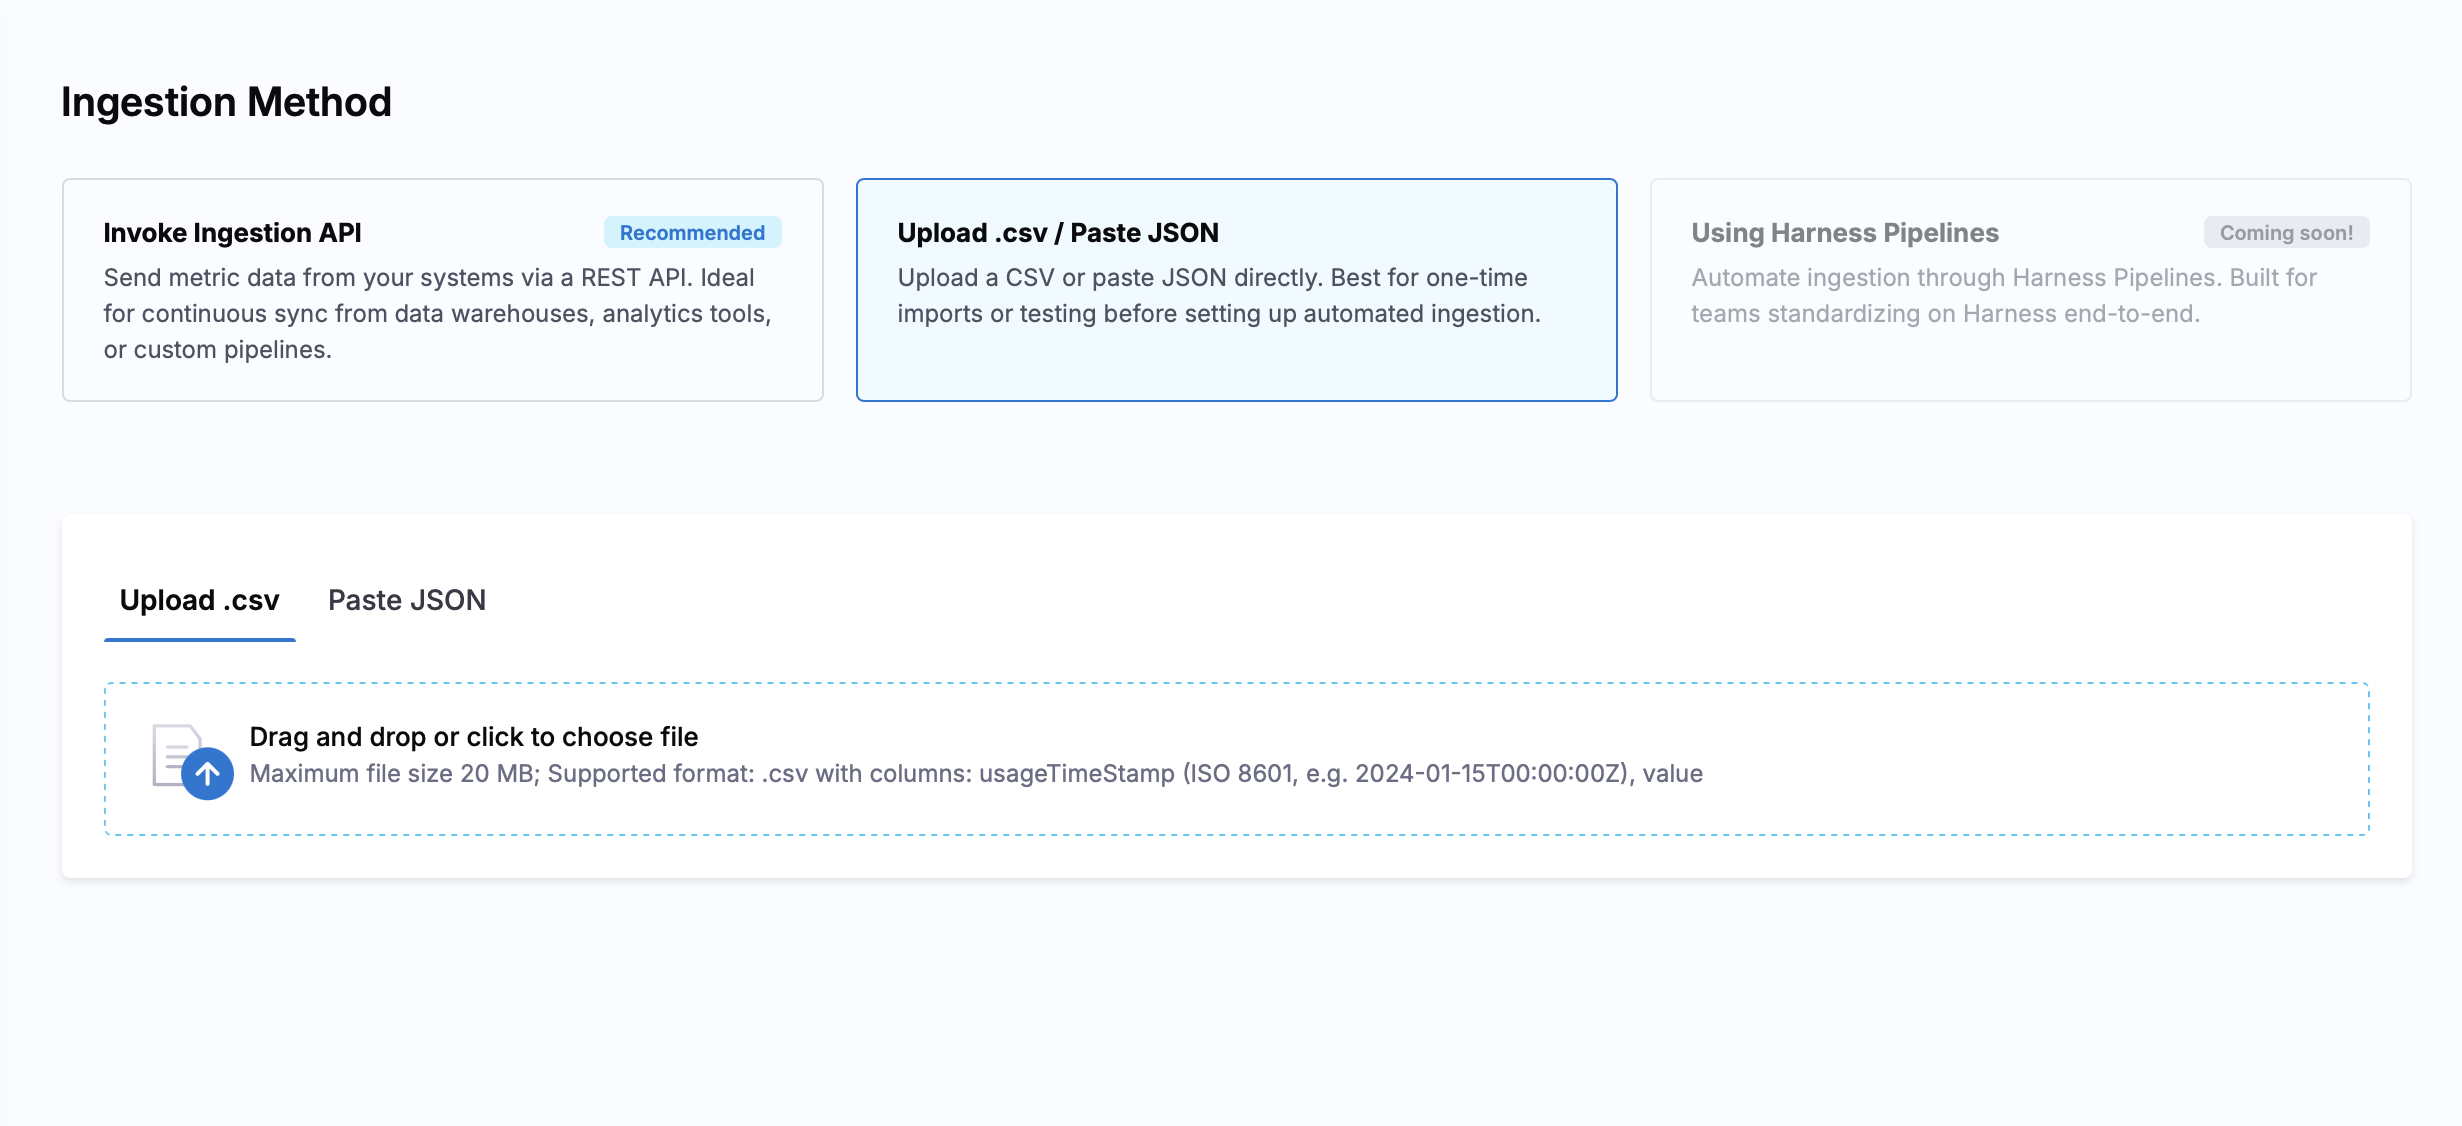
Upload .CSV/Paste JSON: Upload CSV files or paste JSON data directly through the UI for quick imports or historical data loads.
- Upload .CSV: Structure your CSV with one row per data point. Each row needs a timestamp and a numeric value. You may add an optional label column (e.g., by team). Granularity: daily or monthly. Max 10,000 rows per file.
Expected format
usageTimeStamp,value2025-02-01T00:00:00Z,123452025-03-01T00:00:00Z,123892025-04-01T00:00:00Z,11980With a label column (optional)
usageTimeStamp,team,value2025-02-01T00:00:00Z,ccm,123452025-02-01T00:00:00Z,ci,89202025-03-01T00:00:00Z,ccm,12389The UI validates your CSV and reports errors for: Invalid header format, Missing or malformed timestamps, Non-numeric values, Future dates, Duplicate timestamps.
- Paste JSON: For quick testing or small datasets, paste JSON directly into the UI. Paste a JSON array of objects. Each object needs a timestamp and a numeric value. Add an optional label object if applicable.
Expected format
[{ "usageTimeStamp": "2025-02-01T00:00:00Z", "value": 12345 },{ "usageTimeStamp": "2025-03-01T00:00:00Z", "value": 12389 },{ "usageTimeStamp": "2025-04-01T00:00:00Z", "value": 11980 }]With a label column (optional)
[{ "usageTimeStamp": "2025-02-01T00:00:00Z", "labels": { "team": "ccm" }, "value": 12345 },{ "usageTimeStamp": "2025-02-01T00:00:00Z", "labels": { "team": "ci" }, "value": 8920 }]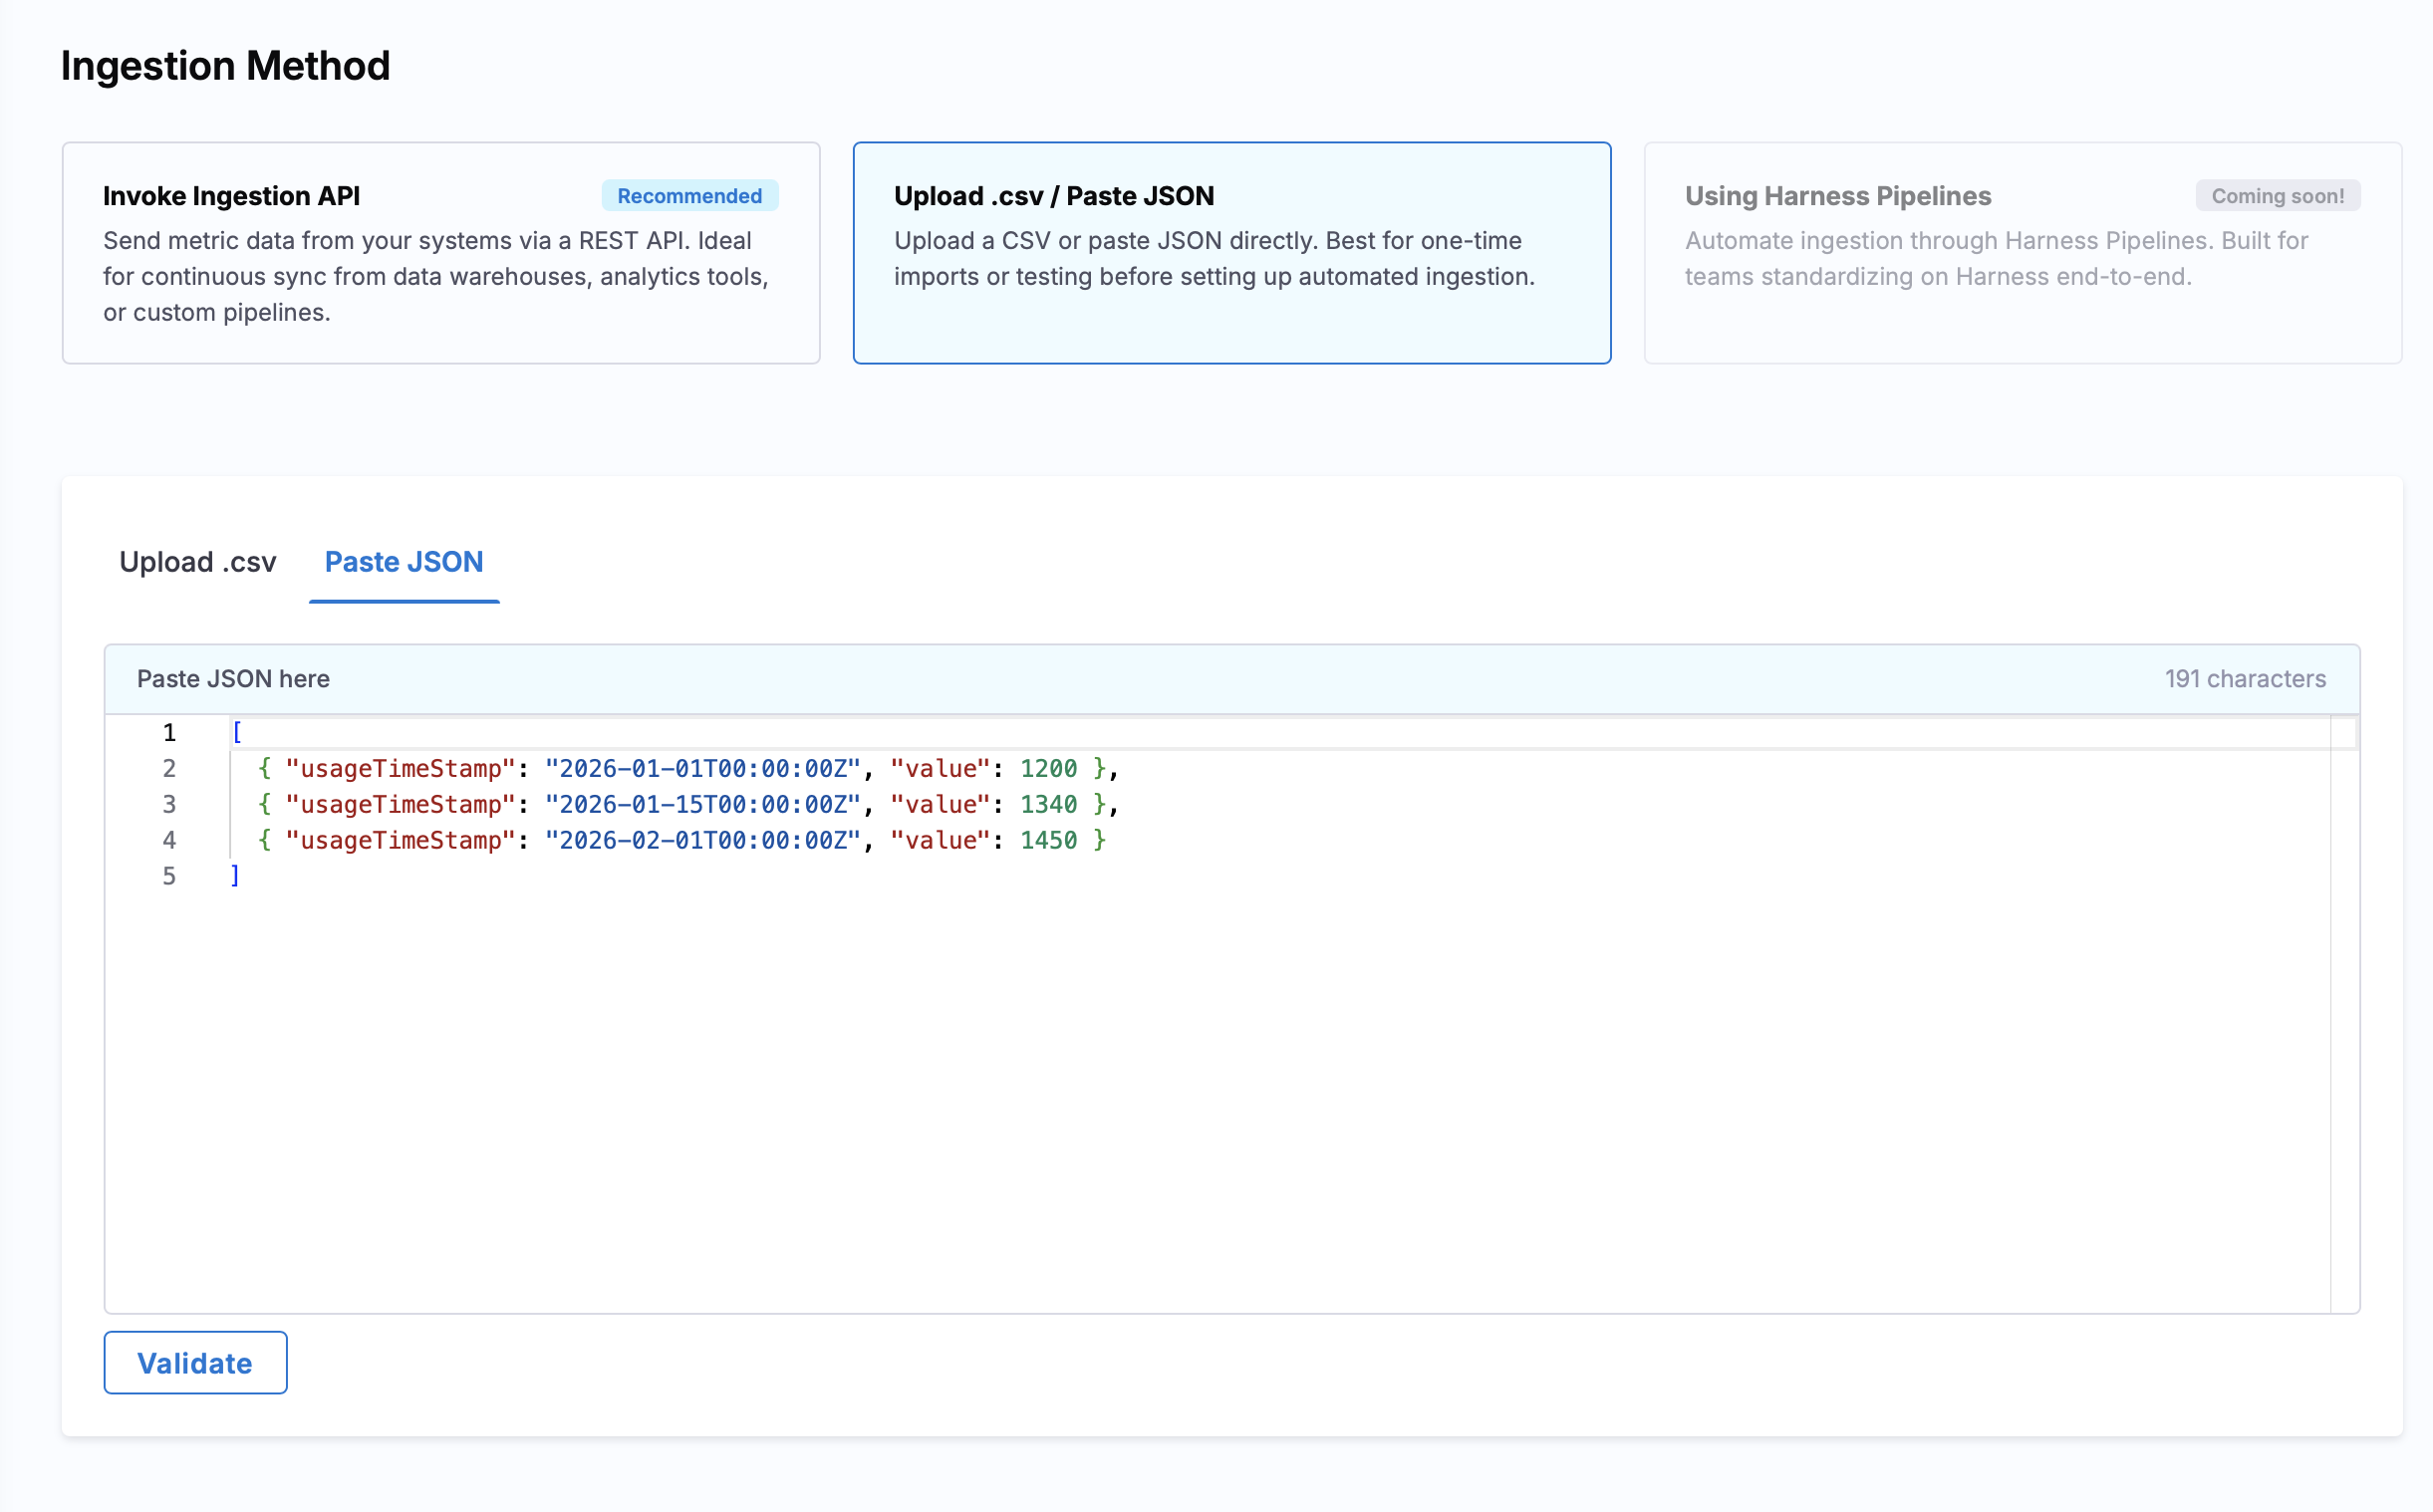
-
Using Harness Pipelines: Coming Soon.
Viewing Unit Metrics
Metrics List View
The main Cloud Integration page shows all your unit metrics in a table with:
- Metric Name: Click to view details
- Labels: Tag-based segmentation
- Last Updated: Timestamp of most recent data ingestion
Metric Details Page
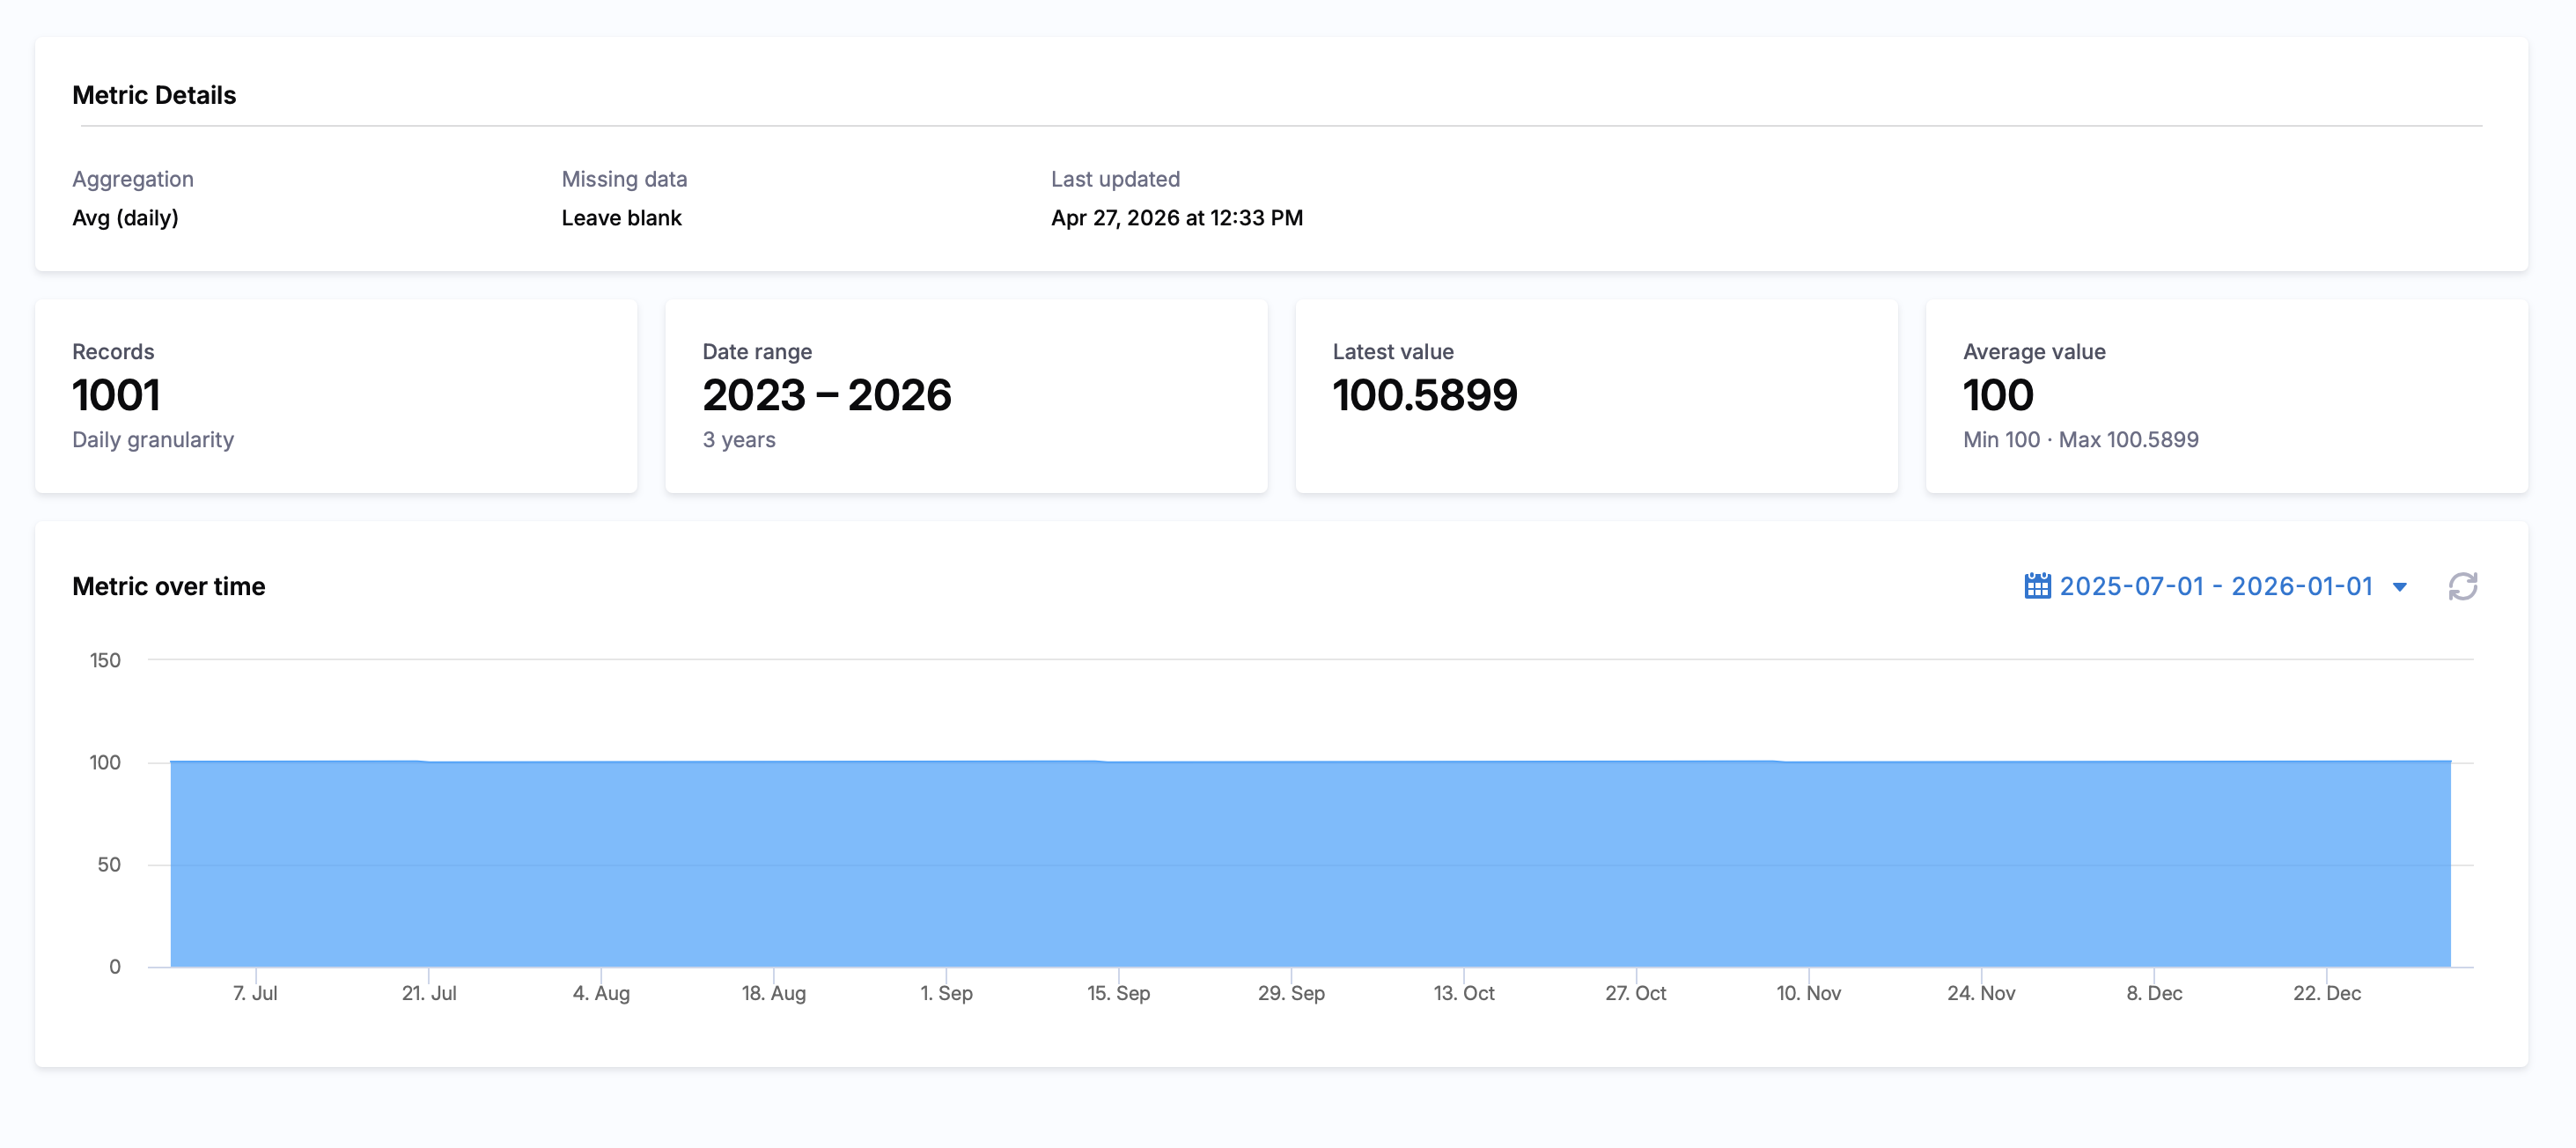
Each metric has a dedicated details page showing:
-
Metric Configuration: Aggregation type, Missing data handling strategy, Last updated timestamp
-
Statistics Cards: Total record count (with granularity), Date range coverage (with duration), Latest value, Average value (with min/max range)
- Metric Over Time Chart: Time-series visualization of metric values with adjustable time range (default: last 6 months)
Editing and Managing Metrics
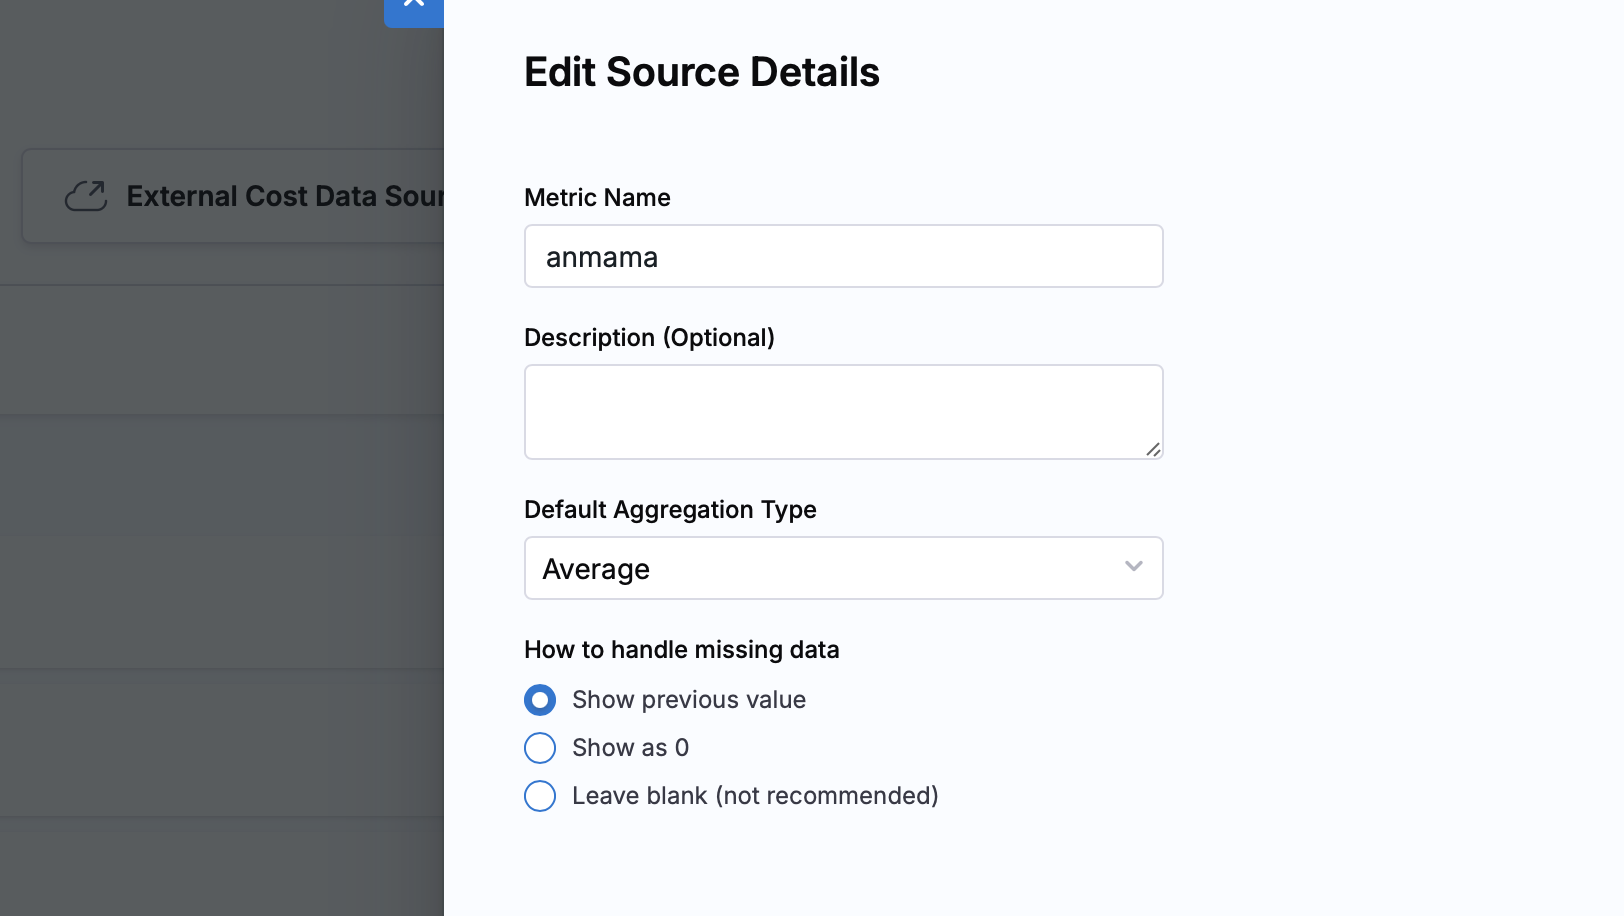
Edit Metric Configuration
You can update:
- Metric name
- Description
- Default aggregation type
- Missing data handling
Note: The metric identifier cannot be changed after creation.
Add Data to Existing Metrics
Use the "Add Data" button to append new records using any ingestion method:
- API: Send additional records via PUT request
- CSV: Upload new data files
- JSON: Paste additional data points
New data is automatically merged with existing records based on timestamps.