Dynatrace
Before you begin
This page assumes you have followed the rest of the steps to set up CV. To learn more, go to Configure CV
Add Dynatrace as a health source
This option is available only if you have configured the service and environment as fixed values.
A Health Source is basically a mapping of a Harness Monitored Service to the Service in a deployment environment monitored by an APM or logging tool.
Define Health Source
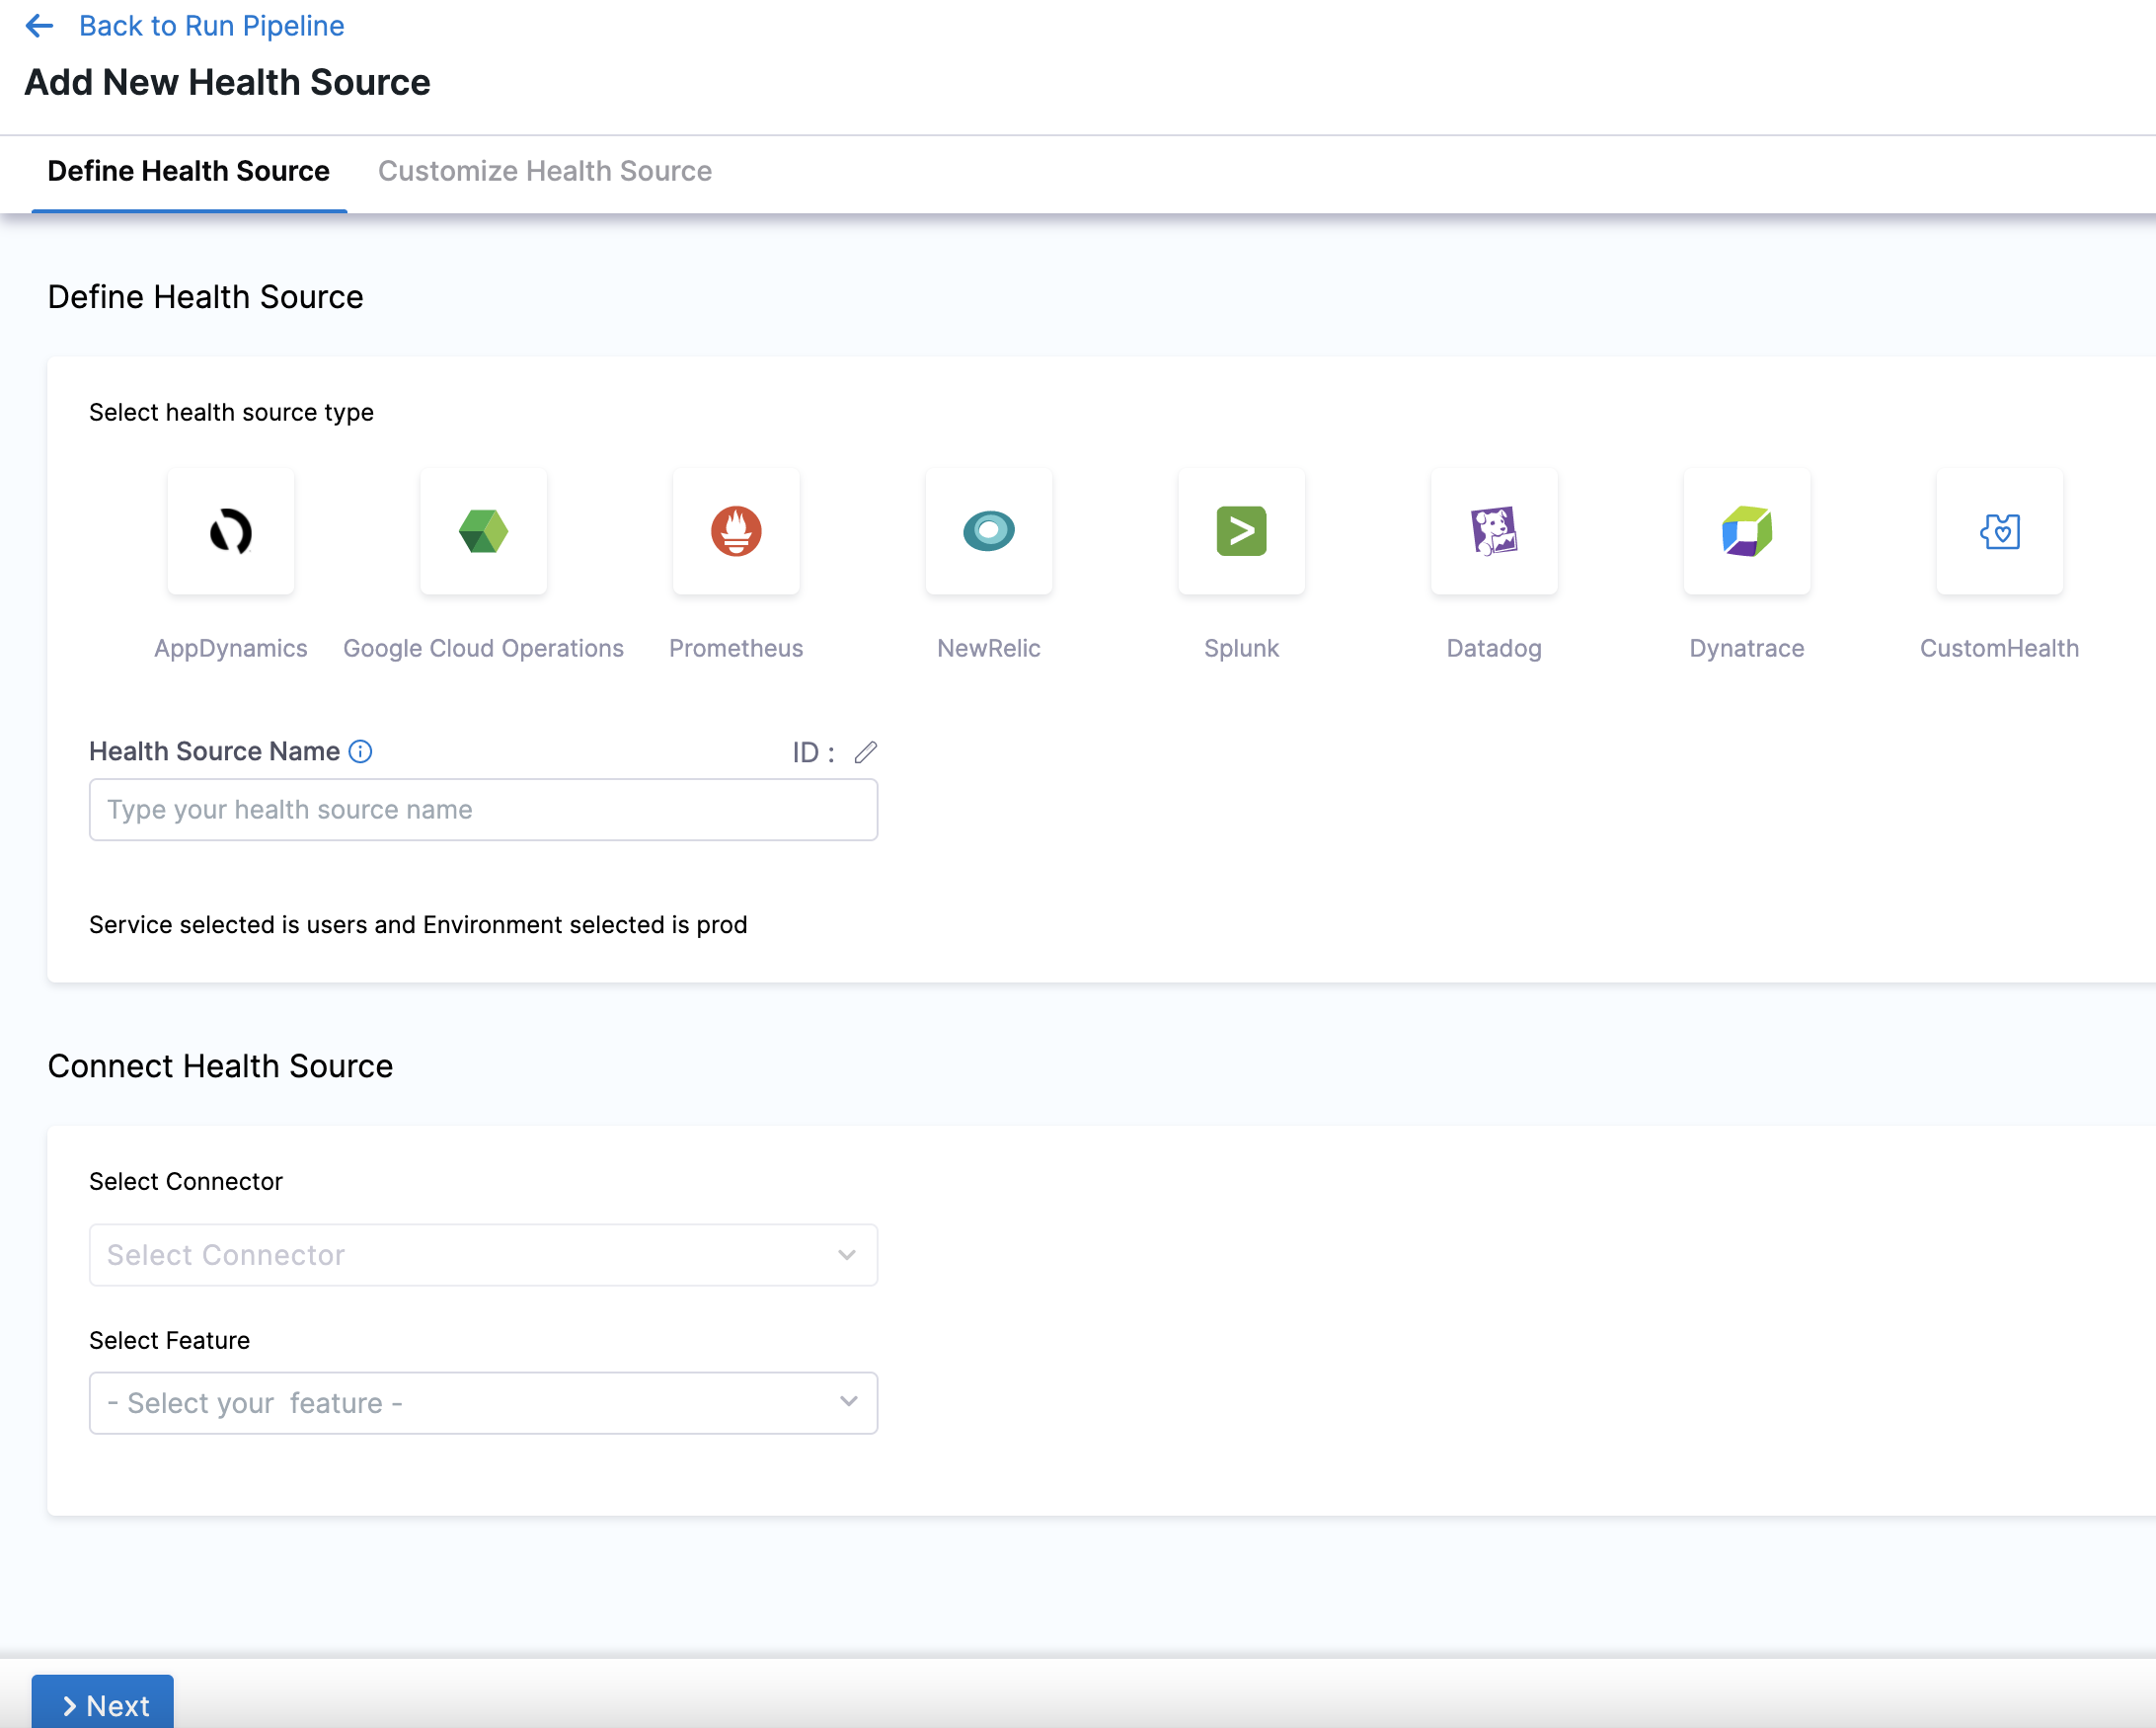
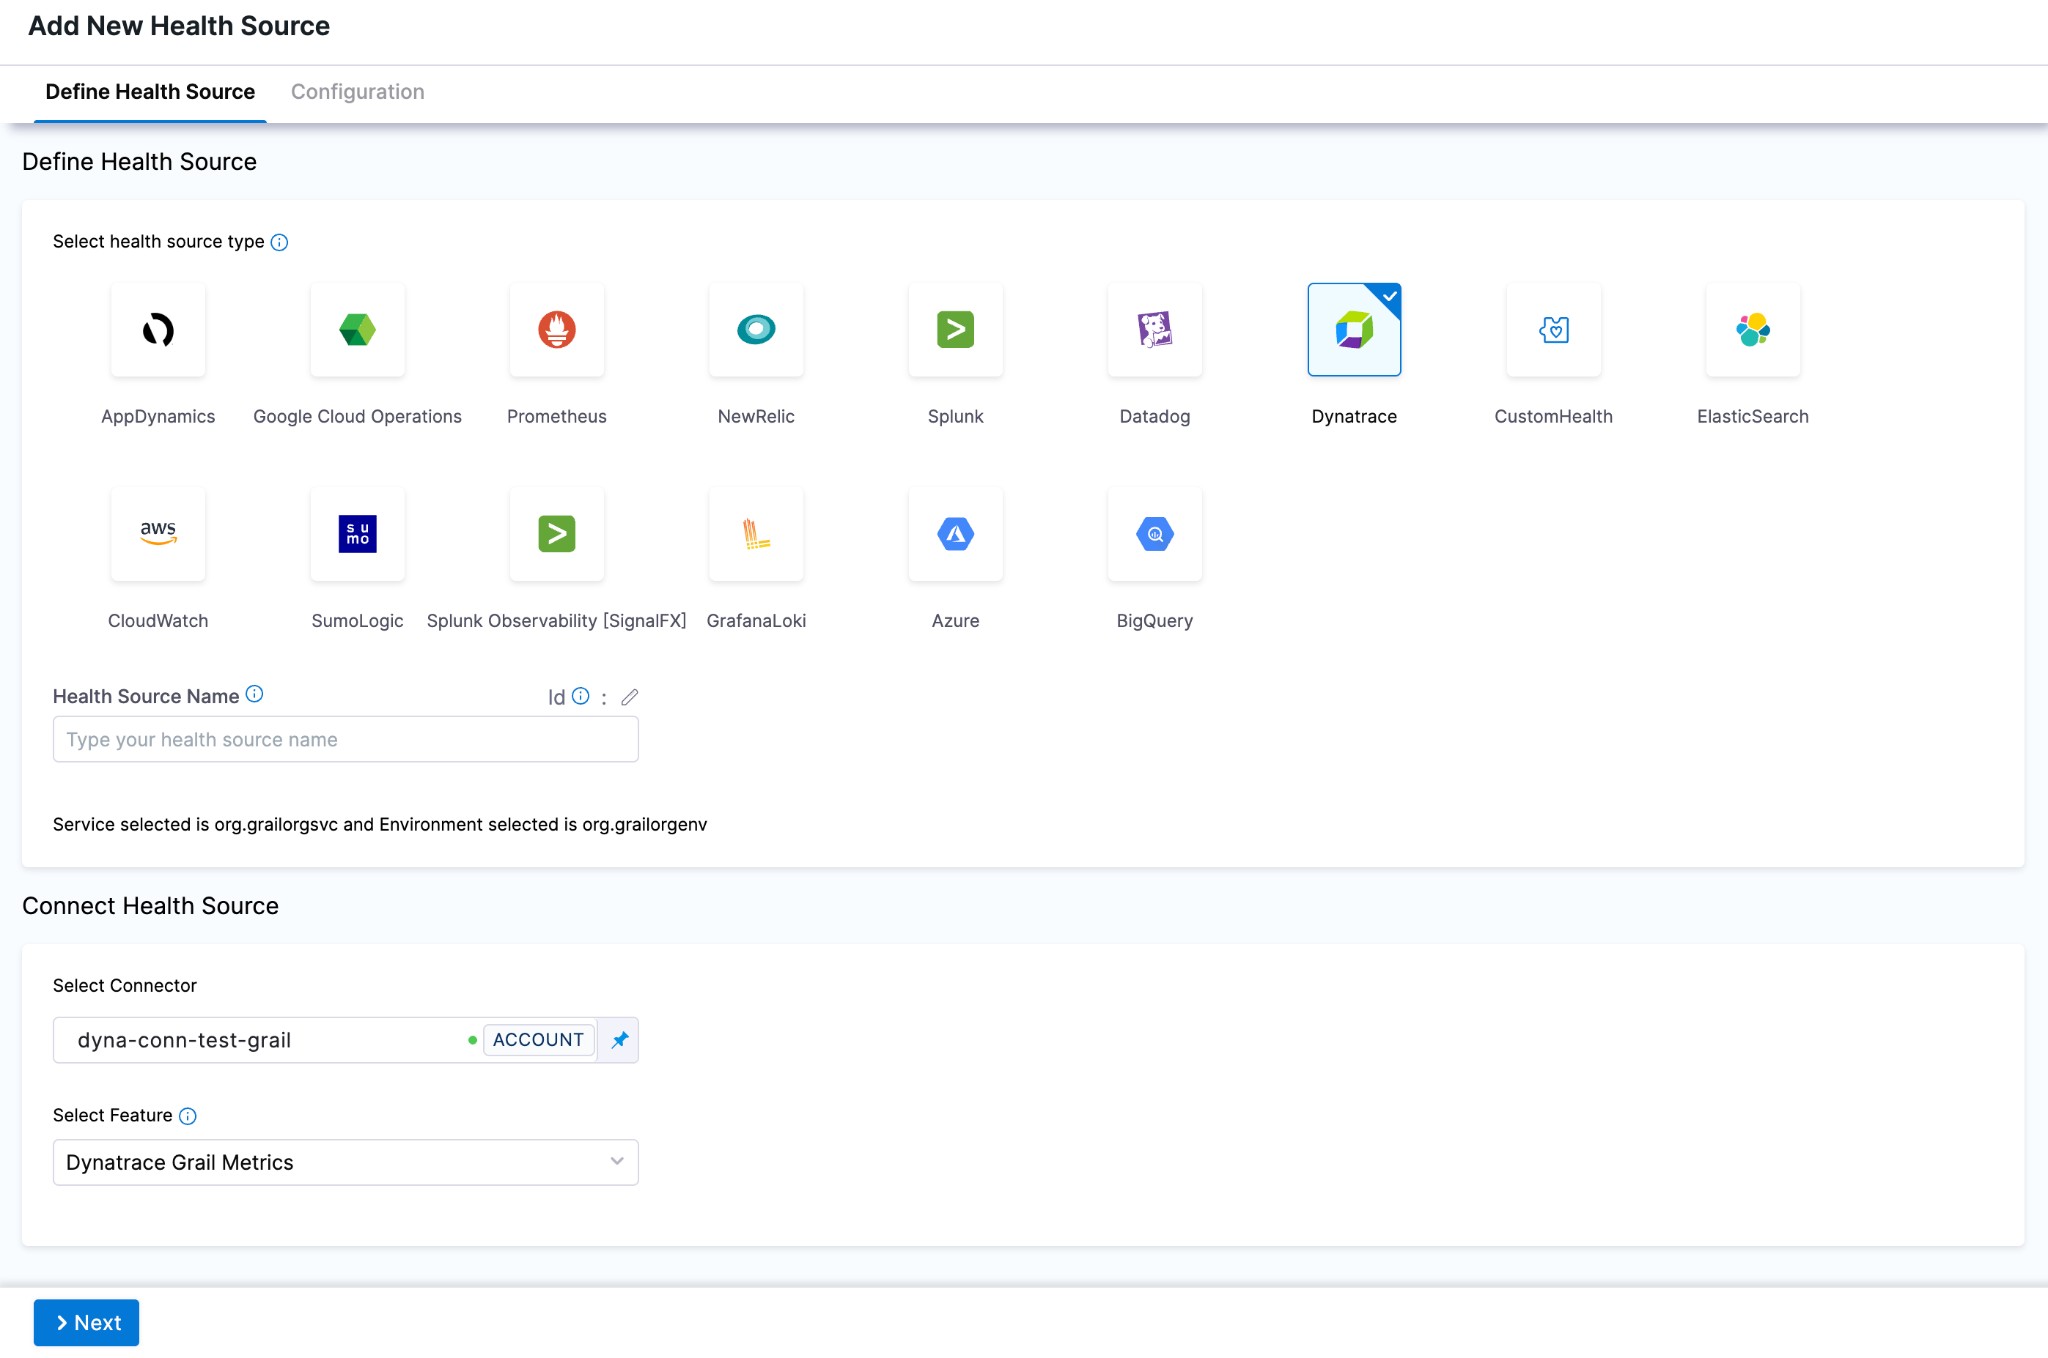
In Health Sources, click Add. The Add New Health Source settings appear.
-
In Select health source type, select Dynatrace.
-
In Health Source Name, enter a name for the Health Source. For example Quickstart.
-
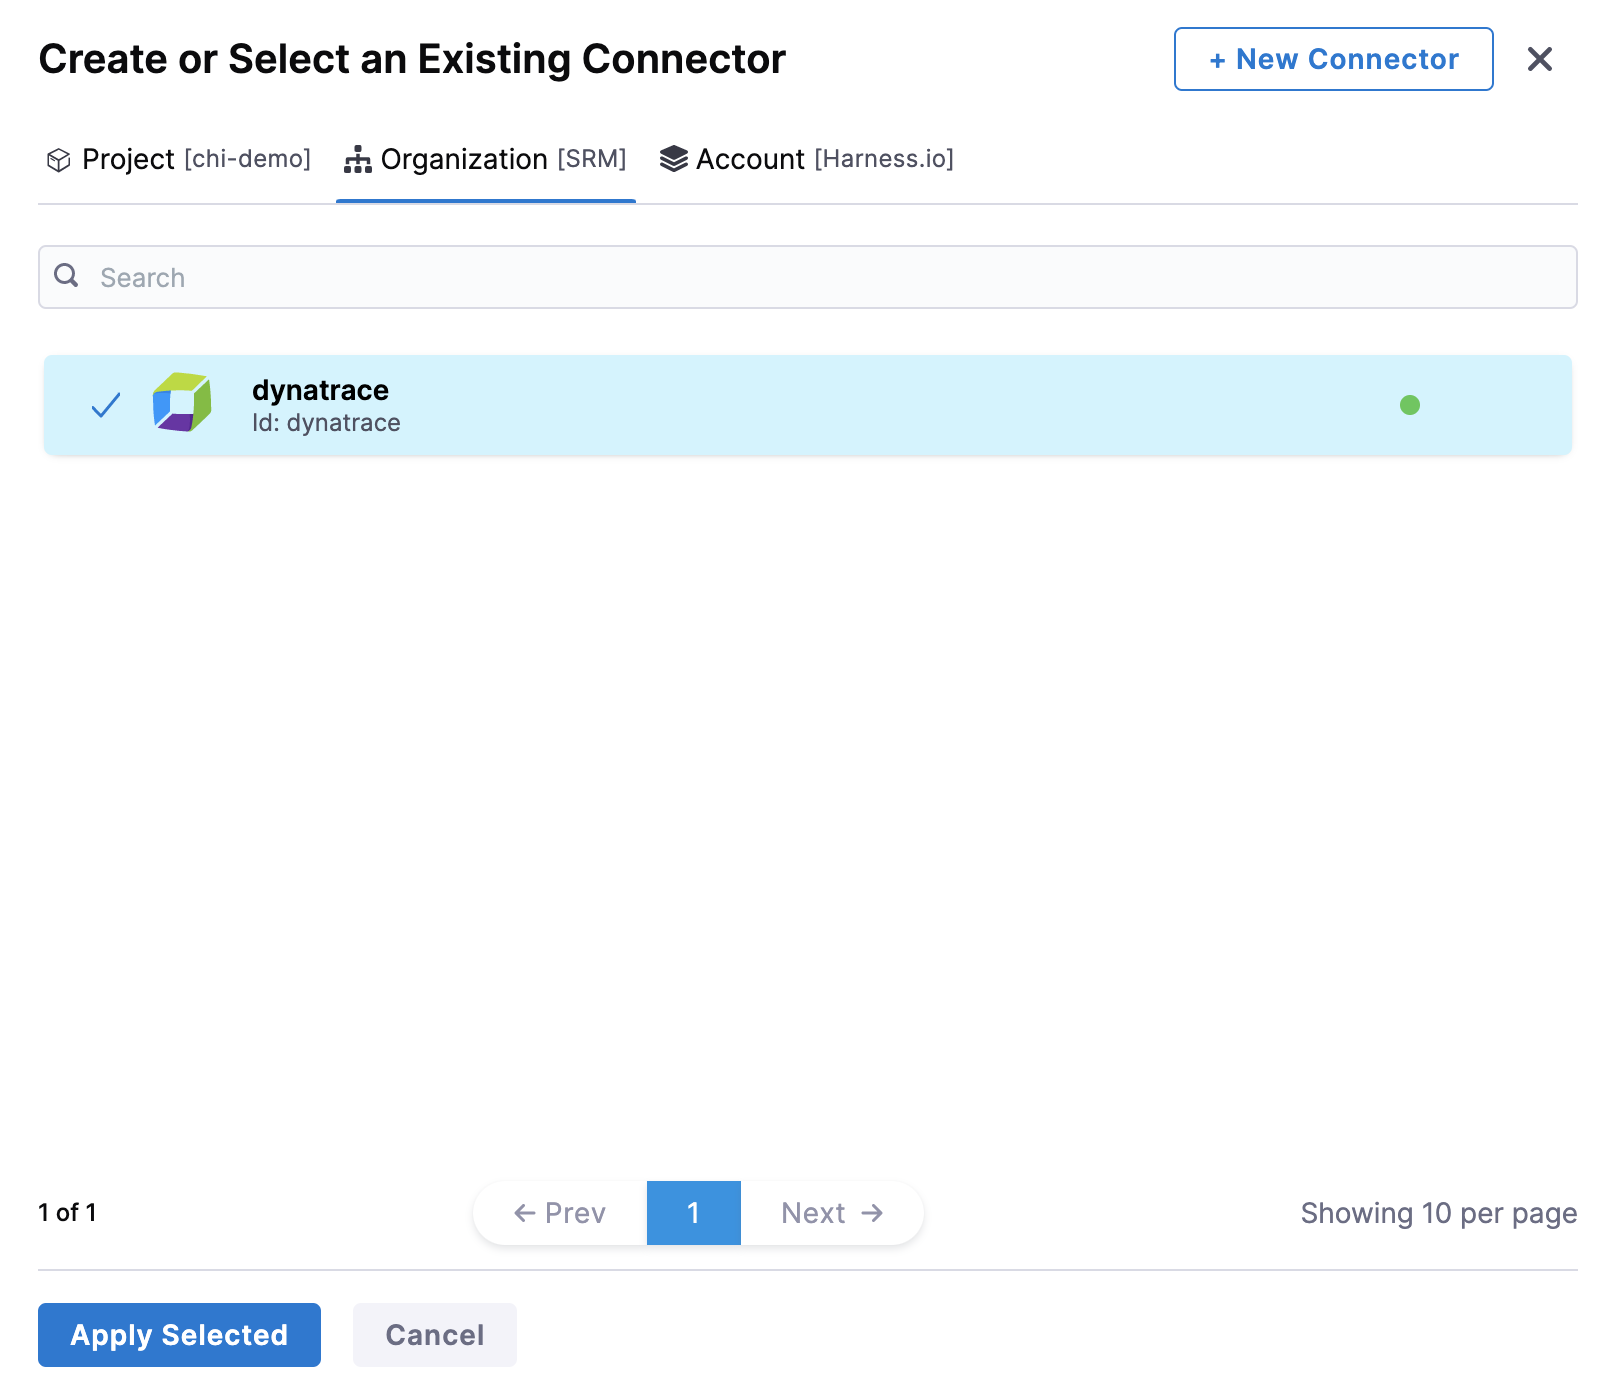
Under Connect Health Source, click Select Connector.
-
In Connector settings, you can choose an existing connector or click New Connector to create a new Connector.
 note
noteWhen creating a new Dynatrace connector:
-
Without the feature flag enabled: You will configure a standard Dynatrace connector with API URL + API Token (for Full Stack Observability metrics).
-
With the feature flag enabled: You can choose between Dynatrace Classic (for Full Stack Observability metrics) or Dynatrace Grail (for Grail Logs). Each connector supports only one type.
For more information on configuring Dynatrace connectors, go to Add Dynatrace connector.
-
-
After selecting the connector, click Apply Selected. The Connector is added to the Health Source.
-
In Select Feature, choose one of the following options. Your choice determines which configuration options appear next.
note- Full Stack Observability: APM requires a Dynatrace Classic connector (API URL + API Token).
- Dynatrace Grail Logs requires a Dynatrace Grail connector (Platform URL + Platform Token) and the feature flag
CDS_CV_DYNATRACE_GRAIL_LOGS_ENABLED. This feature flag requires a minimum delegate version of869xx. Contact Harness Support to enable it. - Dynatrace Grail Metrics requires a Dynatrace Grail connector (Platform URL + Platform Token), the feature flag
CDS_CV_DYNATRACE_GRAIL_METRICS_ENABLED, and a minimum delegate version of88900. Contact Harness Support to enable it.
Configuration
Depending on your feature choice, do the following configuration steps.
- Full Stack Observability: APM
- Dynatrace Grail Logs
- Dynatrace Grail Metrics
-
Click Next. The Configuration settings appear.
-
Next, you will have the choice between using Metric Packs or Custom Metrics.
Choose Metric Packs if you want to use one of the predefined Infrastructure or Performance packs. Choose Custom Metrics to make your own metrics against your data.
You may choose both options.
- Metric Packs
- Custom Metrics
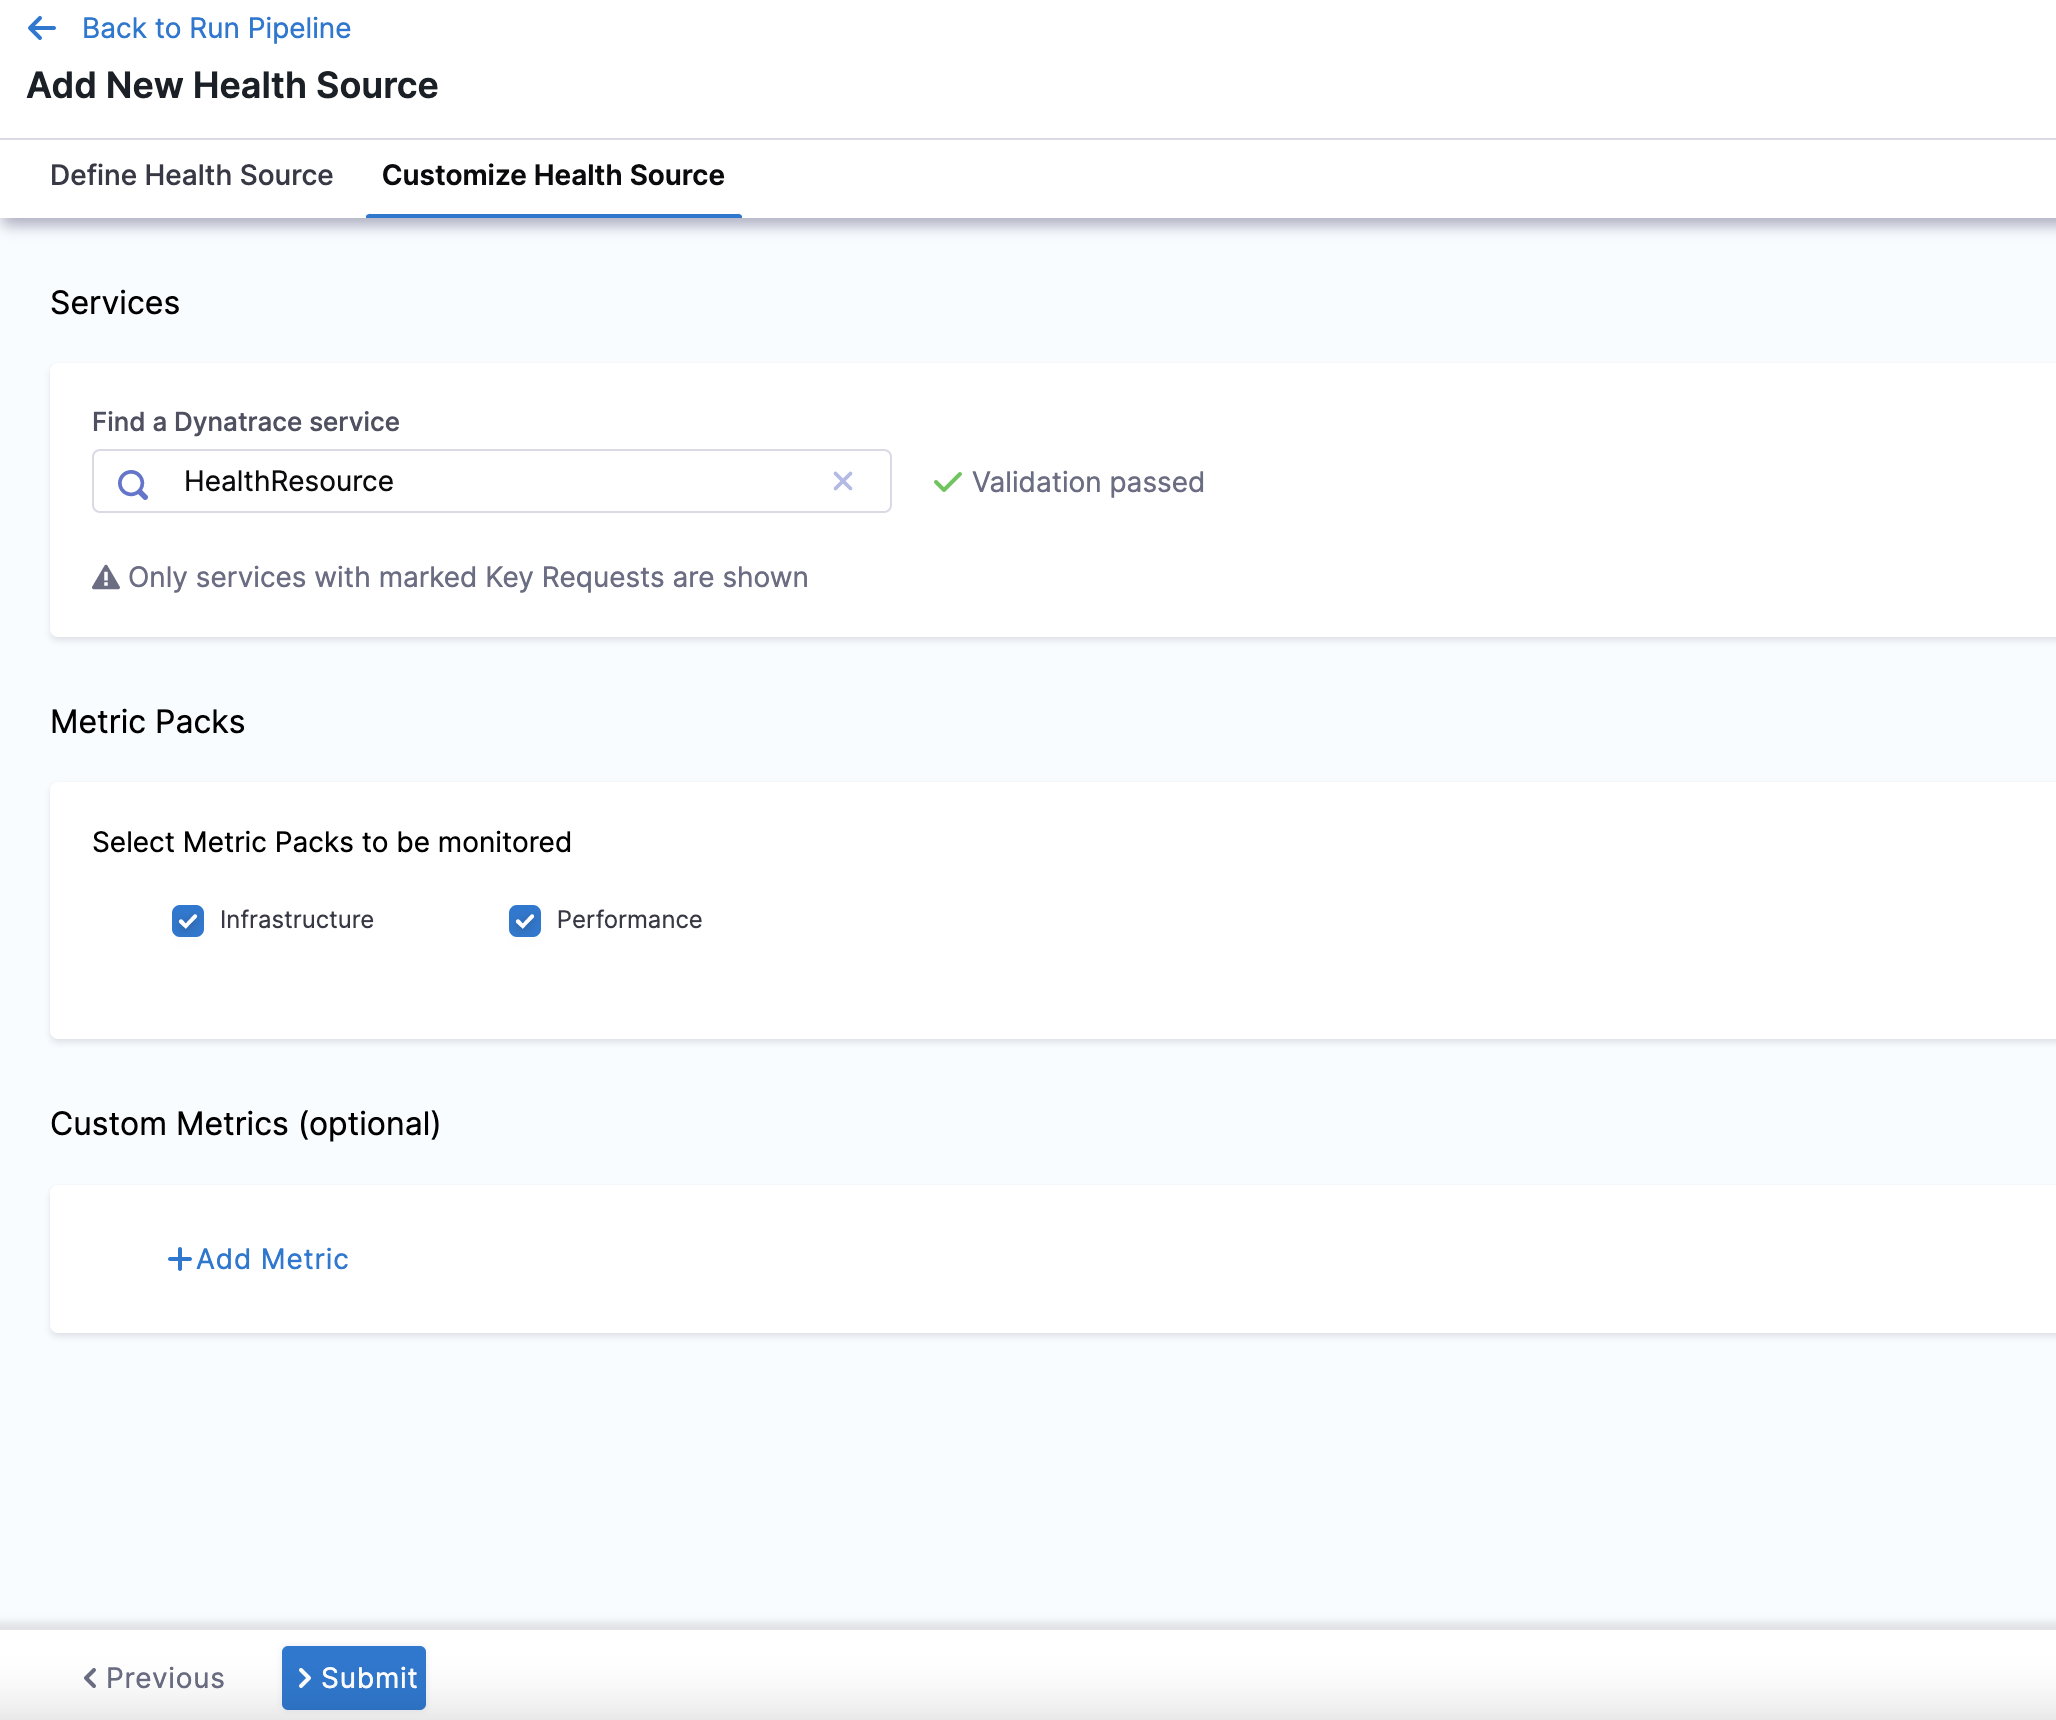
- In Find a Dynatrace service, enter the name of the desired Dynatrace service. This Dynatrace service must be marked as a key request in order to appear in this dropdown menu.
- In Select Metric Packs to be monitored, you can select Infrastructure, Performance, or both.
-
Click Add Metric if you want to add any specific metric to be monitored (optional) or simply click Submit.
-
If you click Add Metric, click Map Metric(s) to Harness Services.
-
In Metric Name, enter the name of the metric.
-
In Group Name, enter the group name of the metric.
-
Click Query Specifications and mapping. To build your query, do the following:
- In Metric, choose the desired metric from the list.
- In Select Metric Filter, choose the desired entity from the list. This will filter your metrics using entitySelectors.
noteSelecting metric filters is behind the feature flag
CDS_CV_DYNATRACE_CANARY_ENABLED. Contact Harness Support to enable this feature.- Click Fetch Records to retrieve data for the provided query.
-
In Assign, choose the services for which you want to apply the metric.
If you select Continuous Verification or Service Health, you will need to configure a risk profile. Expand the following block to learn more.
Risk Profile settings
Risk Profile
The Risk Profile section is only visible if you have selected Continuous Verification (Applied to the pipelines in the Continuous Deployment) or Service Health in the Assign section.
- Under Risk Category, select one of the following options:
- Errors
- Infrastructure
- Performance/Throughput
- Performance/Other
- Performance/Response Time
- Under Deviation Compared To Baseline, select the following settings to measure your service's behavior and calculate deviations from the health source:
-
Higher counts = higher risk
-
Lower counts = higher risk
Note that you can select multiple options.
Map service instance identifier
The Map service instance identifier (SII) section is only visible if you have selected Continuous Verification (Applied to the pipelines in the Continuous Deployment) in the Assign section.
In Service Instance Identifier (only needed for CV), specify the service instance identifier, which represents a dynamically created service that you deploy using Harness. The default value is _sourceHost.
This field allows CV to identify the name of the host which has emitted the metric/log.
Picking the right service instance identifier is important, and depends on the kind of metric that you want to monitor. As an example, for Kubernetes deployments, the best selection will typically be pod, <podname>, or <containername>.
When creating a monitored service template, you can decide to choose the service instance identifier at runtime.
When doing canary deployments, ensure that the SII can be used to identify the canary instance of the service, or CV will not work properly.
For Dynatrace, the only possible values of the SII are your entity selectors.
The ability to set a SII is behind the feature flag CDS_CV_DYNATRACE_CANARY_ENABLED. Contact Harness Support to enable this feature.
Finally, Click Submit. The Health Source is displayed in the AI Verify (v1) step.
You can add one or more Health Sources for each APM or logging provider.
This feature is behind the feature flag CDS_CV_DYNATRACE_GRAIL_LOGS_ENABLED. This feature requires a minimum delegate version of 869xx.
Contact Harness Support to enable the feature flag.
-
Click Next. The Configuration settings will appear. You should see one button, + Add Query.
-
Click + Add Query.
-
Choose a Query name and click Submit.
-
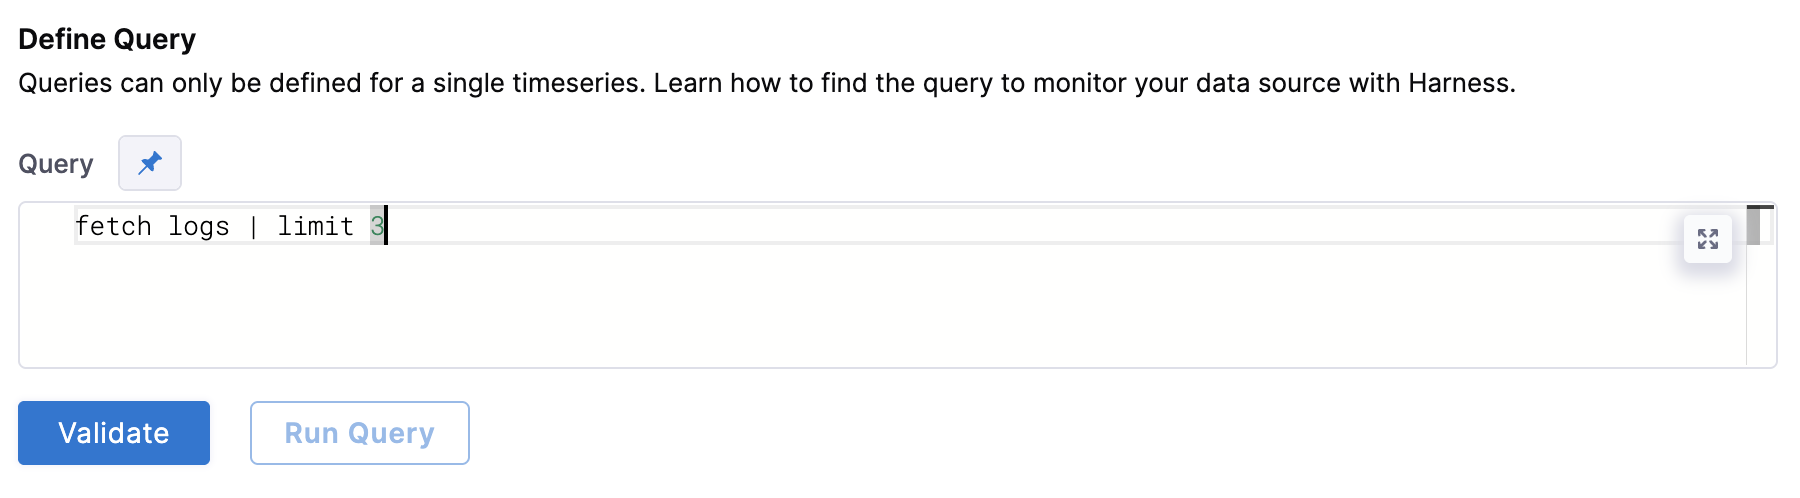
Under Define Query, enter your query. This query can also be a runtime input or expression.
-
After writing your fixed input query, click Validate to ensure your query is valid.
-
Then click Run Query. The query must be validated first from the previous step.
-
Next, complete the field mapping for the Timestamp Identifier, Service Instance Identifier, and Message Identifier. To do so, hit the
+button icon and select the relevant field from the log that appears.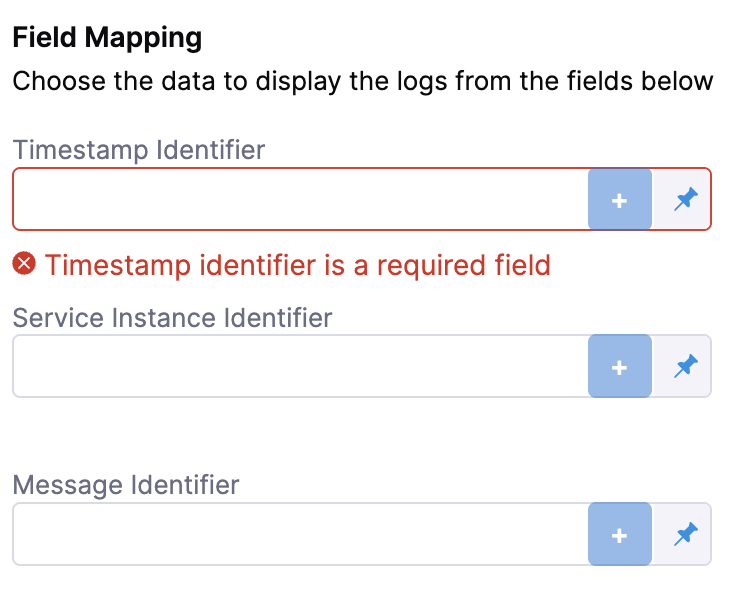
-
Click Submit. The health source is displayed in the AI Verify (v1) step!
This feature is behind the feature flag CDS_CV_DYNATRACE_GRAIL_METRICS_ENABLED and requires a minimum delegate version of 88900.
Contact Harness Support to enable the feature flag.
Dynatrace Grail Metrics uses Dynatrace Query Language (DQL) to query timeseries metric data from the Dynatrace Grail data lakehouse. You write a timeseries DQL query, validate it, fetch sample records, and then map the metric value column and service instance dimension to Harness for continuous verification and live monitoring.
Map metric to Harness services
-
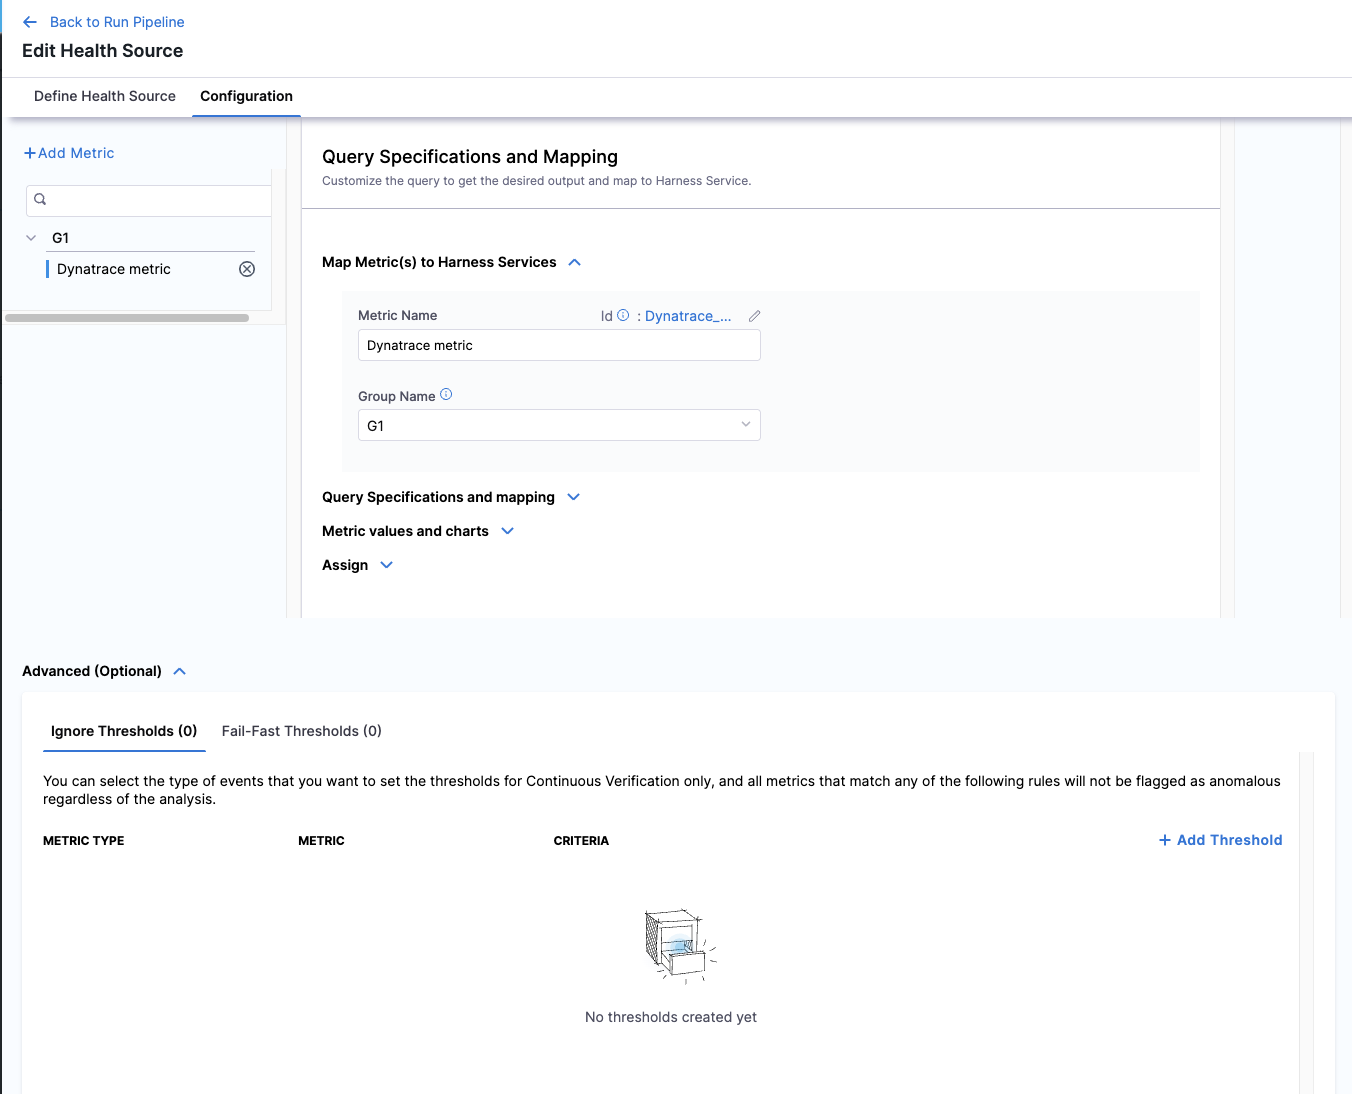
Click Next. The Configuration tab opens. Click + Add Metric.
-
In Metric Name, enter a name for the metric.
-
In Group Name, select an existing group or type a new one to create it.
Write and validate the query
-
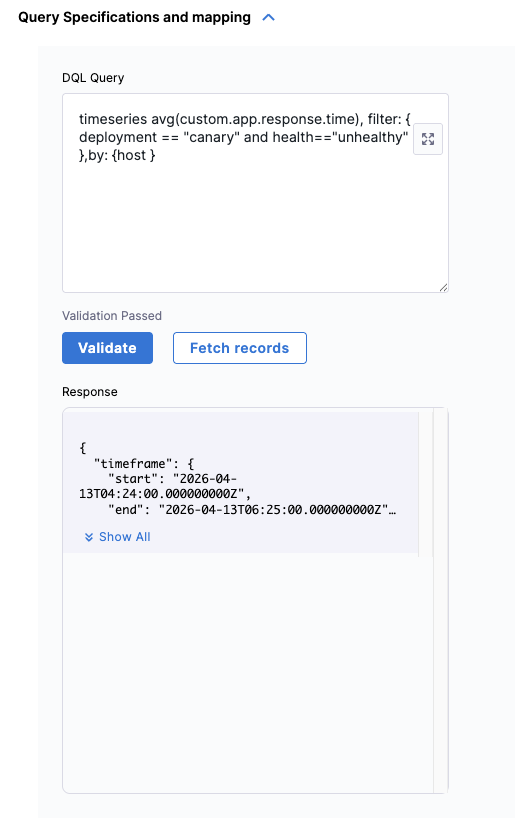
Expand Query Specifications and mapping and enter your DQL
timeseriesquery in the DQL Query field. The query must start with thetimeseriescommand.timeseries avg(custom.app.response.time), filter: {deployment == "canary" and health=="unhealthy"}, by: {host}tipThe
by:clause splits results per dimension (for example,by: {host}). Include it when you need per-instance data for continuous verification. You can omit it for aggregate SLI queries, but note that a Service Instance Identifier is required when Continuous Verification is enabled. -
Click Validate. When the query is syntactically correct, a Validation Passed confirmation appears below the query field.
-
Click Fetch Records. Harness runs the query against your Dynatrace environment and shows the raw JSON response inline.
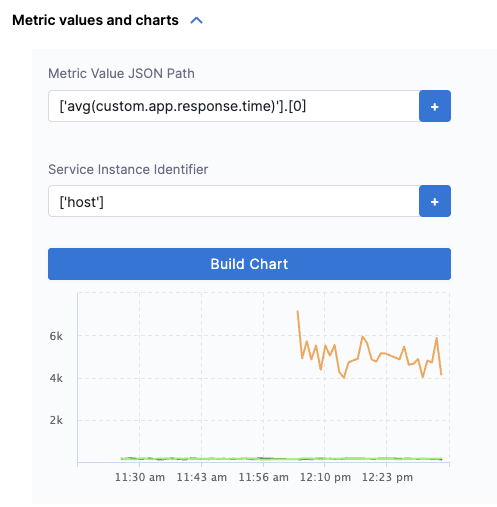
Configure metric values and charts
-
Expand Metric values and charts. Harness auto-populates the fields based on the sample response. Review and confirm the following:
- Metric Value JSON Path — the JSONPath to the metric values array in the response (for example,
['avg(custom.app.response.time)'].[0]). - Service Instance Identifier — the JSONPath to the dimension that identifies each service instance (for example,
['host']). Required when Continuous Verification is enabled.
- Metric Value JSON Path — the JSONPath to the metric values array in the response (for example,
-
Click Build Chart to preview the timeseries chart from your live data. Verify the chart renders correctly before proceeding.
 info
infoDQL
timeseriesresponses return metric values as arrays where each element corresponds to one time slot. Harness reconstructs per-point timestamps usingtimeframe.startandintervalfrom the response. Becauseintervalis in nanoseconds, Harness converts it before applying the formula:timestamp[i] = timeframe.start + (i × (interval / 1,000,000))
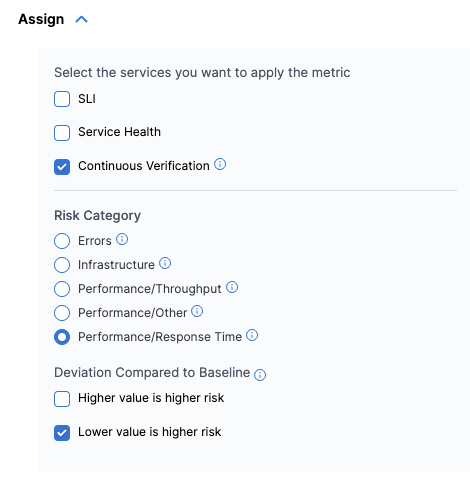
Assign and configure risk profile
-
Expand Assign and select which services this metric applies to:
- SLI — uses the metric to track SLO compliance.
- Service Health — monitors the metric continuously outside of deployments.
- Continuous Verification — gates deployments based on this metric.
If you select Continuous Verification or Service Health, configure the Risk Category and Deviation Compared to Baseline:
- Risk Category — select one of Errors, Infrastructure, Performance/Throughput, Performance/Other, or Performance/Response Time.
- Deviation Compared to Baseline — select Higher value is higher risk, Lower value is higher risk, or both, depending on what the metric measures.
Configure advanced thresholds (optional)
-
Expand Advanced (Optional) to configure metric thresholds. There are two threshold types:
- Ignore Thresholds — metrics matching these rules are excluded from anomaly flagging during continuous verification.
- Fail-Fast Thresholds — metrics matching these rules immediately fail the verification step.
Click + Add Threshold to define rules by metric type, metric name, and criteria.
-
Click Submit. The health source is displayed in the AI Verify (v1) step.
Sample DQL timeseries queries
The following queries illustrate common patterns for use with the Dynatrace Grail Metrics health source.
CPU usage grouped by host:
timeseries usage=avg(dt.host.cpu.usage), by:{dt.entity.host}
Service response time at the 90th percentile:
timeseries p90=percentile(dt.service.request.response_time, 90),
    filter:{startsWith(endpoint.name, "/api/accounts")}
Failure rate per second:
timeseries sum(dt.service.request.failure_count, rate:1s),
    filter:{startsWith(endpoint.name, "/api/accounts")}
Multiple disk metrics in one query:
timeseries {
    bytes_read=sum(dt.host.disk.bytes_read),
    bytes_written=sum(dt.host.disk.bytes_written)
}, by:{dt.entity.host}
Week-over-week availability comparison:
timeseries avail=avg(dt.host.disk.avail), by:{dt.entity.host}, from:-24h
| append [
    timeseries avail_7d=avg(dt.host.disk.avail), by:{dt.entity.host}, shift:-7d
]
For the full DQL timeseries reference, see the Dynatrace DQL timeseries documentation.
Sample Dynatrace queries
Latency
- Latency trend over time:
timeseries(avg(response.time)) - Latency distribution:
histogram(response.time) - Latency by application version:
avg(response.time) by application.version - Latency by geographical region:
avg(response.time) by geoip.country_name - Latency spike detection:
spike(response.time) - Latency comparison between environments:
avg(response.time) by environment - Latency by HTTP method:
avg(response.time) by http.method - Latency by service:
avg(response.time) by service.name - Latency anomaly detection:
anomaly(response.time) - Latency percentiles:
percentile(response.time, 50),percentile(response.time, 90),percentile(response.time, 99)
Traffic
- Requests per minute trend:
timeseries(count(request) / 60) - Requests by HTTP status code:
count(request) by http.status_code - Requests by user agent:
count(request) by useragent.name - Requests by endpoint and HTTP method:
count(request) by endpoint, http.method - Requests by response time range:
histogram(response.time) - Requests by geo-location:
count(request) by geoip.country_name - Slow endpoint detection:
top(avg(response.time), 10, endpoint) - Requests by hostname:
count(request) by hostname - Requests by service:
count(request) by service.name - Requests by HTTP version:
count(request) by http.version
Errors
- Error rate trend over time:
timeseries(count(error) / count(request) * 100) - Top error types:
count(error) by errorType - Error rate by geographical region:
count(error) by geoip.country_name - Error rate by application version:
count(error) by application.version - Error rate by HTTP status code:
count(error) by http.status_code - Error rate by service:
count(error) by service.name - Error rate by user agent:
count(error) by useragent.name - Error spike detection:
spike(count(error)) - Error anomaly detection:
anomaly(count(error))
Saturation
- CPU utilization across hosts:
avg(cpu.usage) by host - Memory utilization across hosts:
avg(memory.usage) by host - Disk utilization across hosts:
avg(disk.usage) by host - Network utilization across hosts:
avg(network.usage) by host - CPU utilization by geographical region:
avg(cpu.usage) by geoip.country_name - Memory utilization by geographical region:
avg(memory.usage) by geoip.country_name - Disk utilization by geographical region:
avg(disk.usage) by geoip.country_name - Network utilization by geographical region:
avg(network.usage) by geoip.country_name